gdb-wui
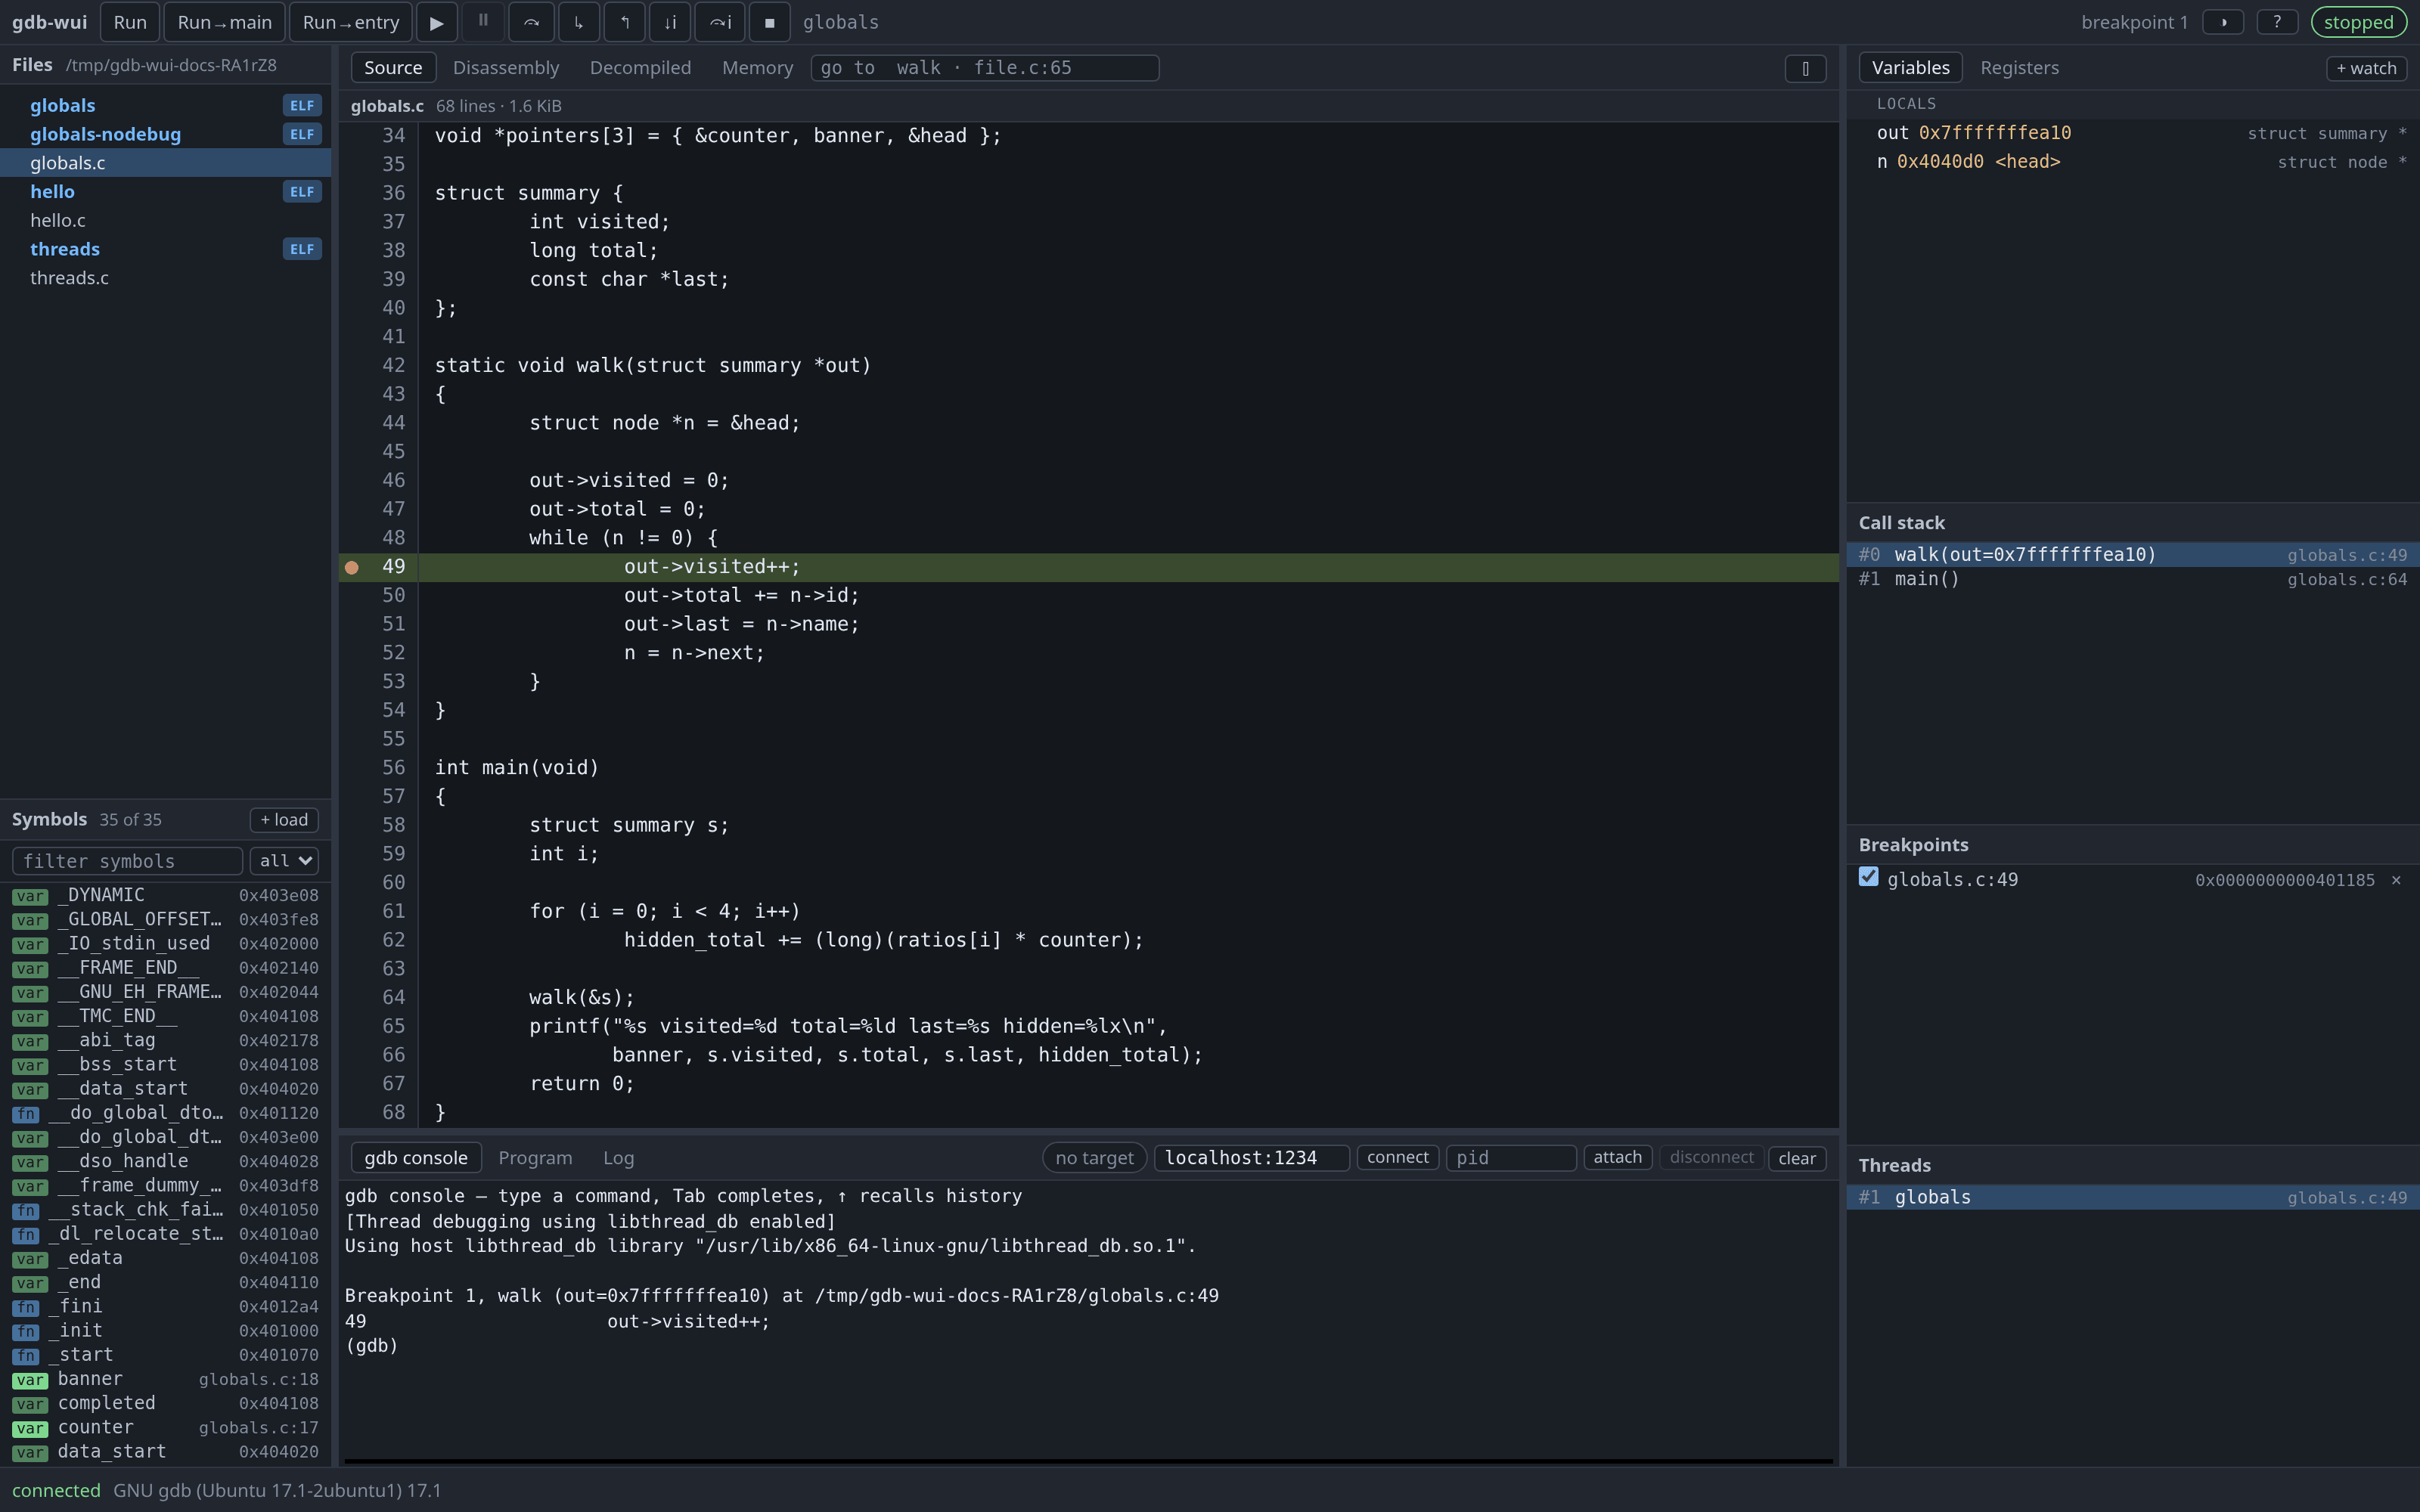
gdb-wui is a web UI for GDB. It shows source, disassembly, variables, registers, memory, threads and a gdb console in a browser tab, while GDB itself does the debugging.
go build ./cmd/gdb-wui
./gdb-wui -project /path/to/your/repo
gdb-wui prints a URL and opens a browser at it. To start debugging, pick an executable from the file tree, click a line number to set a breakpoint, and step.
Or try it in your browser, with nothing to install: gdb-wui and gdb on an emulated ARM64 or RISC-V Linux machine.
gdb-wui runs your programs with your privileges. That is what a debugger does; sandboxing the program being debugged is not a goal.
gdb-wui listens on loopback only, and refuses a non-loopback address unless you pass
-listen-anywhere. Do not expose it to a network you do not control: anyone who can reach the port can run programs as you.Binding to loopback is not sufficient on its own, because any web page you visit can
fetcha loopback URL. Access therefore needs a single-use login link, and requests are checked against DNS rebinding in three ways. These are described in the protocol document.
Why
GDB’s own interfaces are a console or the tui mode. Neither shows source, disassembly, registers, the call stack and thread state at the same time, and neither lets you click a gutter to set a breakpoint.
gdb-wui translates rather than debugs: it speaks GDB/MI to a real gdb process, and a small JSON protocol to the browser. It implements no debugger logic of its own, so you get gdb’s behaviour — including gdb’s error messages, unedited, when something does not work.
This also sets the limit of what gdb-wui can do. If gdb cannot do something, neither can gdb-wui.
Where to start
- Try it in your browser — gdb-wui on an emulated Linux machine, with programs to debug, before you install anything.
- Install — what you need, and what is optional.
- A first session — load a program, break, step and inspect it, in about five minutes, using a program in this repository.
- Features — one page per feature, each listing what it does not do.
- Troubleshooting — errors you may see, and what they mean.
What gdb-wui is good at
Stepping through C or C++ built with -g works. These are what gdb-wui adds:
- Binaries with no source. The Symbols pane reads the ELF symbol table, the disassembly is a first-class view rather than a fallback, and if Ghidra is installed the Decompiled tab shows recovered C with the program counter marked in it. Ghidra also names the call stack, which gdb otherwise reports as a column of
?? (). Its names are things you can act on rather than text:FUN_0010e2dcandDAT_001a08defill the symbol pane of a binary that has no symbols, resolve in the go-to box and as breakpoint locations, and label the breakpoint and watch rows that would otherwise be bare addresses. And you can rename and retype what it guessed and comment what you work out, as you go. - Handing the work to an agent.
gdb-wui -mcpserves MCP for a running session, so an agent can set a breakpoint, run to it, read what is actually in the variable and write the conclusion into the decompilation — which is the part it cannot do against a decompiler alone. What it writes is marked as its own and undone a run at a time, and it needs one flag to annotate and another to run your program. -
Other architectures. Use
-gdbto select a suitable gdb, then connect to a stub — a gdbserver, qemu, an emulator, or a board on a probe.gdb-wui holds no architecture-specific knowledge of its own. Registers, disassembly, frames and memory all come from gdb and are passed through as reported, so any architecture the gdb you select supports should work. Tested rather than assumed: every push builds the same program for ARM, AArch64, PowerPC, PowerPC64 in both endiannesses, MIPS and MIPS64, debugs each of them under qemu, and does x86-64 natively.
The one exception is the Decompiled tab, which has to turn Ghidra’s stack offsets into expressions gdb can evaluate. That is one rule — a variable’s address is the stack pointer at function entry plus its offset — and it is measured against a live inferior on each of the architectures above. Outside those families, and in a frame whose depth Ghidra cannot settle on, stack variables show no value; everything else in that tab still works.
- Images that do not run where they were linked. Load symbols at an offset and the addresses line up again.
- Identifying what you are looking at. The memory viewer names the symbol each row falls in, and hovering a variable reads the whole expression rather than the word under the pointer.
- Trying a different value. Double-click a variable, a register or a byte of memory to change it and carry on from there.
About
The ? button in the toolbar shows the version of gdb-wui you are running, the gdb it is driving, and where the licence and this documentation live. The same on this site, with what is vendored and under which licence: about gdb-wui.