Registers
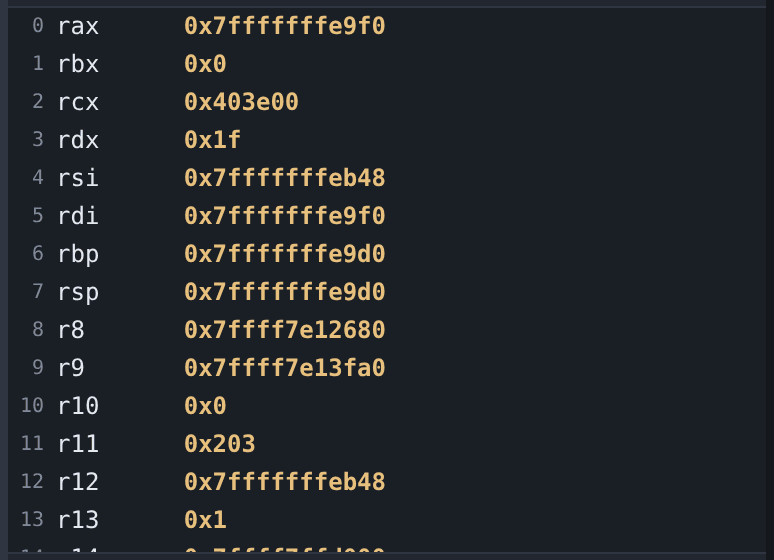
The Registers tab lists whatever gdb reports for the target’s architecture, in gdb’s order, read from the frame selected in the call stack. Registers that changed at the last stop are marked, which makes single-stepping through a prologue easier to follow.
To change a register, double-click its value. See changing values.
The number beside each name is gdb’s register number. It is the register’s real identity: gdb’s list has gaps at stable indices, so a register with no name is normal rather than a fault.
To see what a register points at, use it with hover in the disassembly: point at %rax to read it, or right-click it and choose Show what it points to to open the memory viewer at that address.
Worked example
mkdir -p /tmp/tour && cp testdata/fixtures/globals.c /tmp/tour/
gcc -g -O0 -no-pie -o /tmp/tour/globals /tmp/tour/globals.c
./gdb-wui -project /tmp/tour -exe globals
Break on walk and press Run. rip reads 0x401162 — twelve bytes into walk, past the prologue the breakpoint skipped. Switch to the Registers tab and step one instruction with Alt+F11: the instruction is lea 0x2f67(%rip),%eax, so rip advances to 0x401169 and rax is marked beside it. Nothing else in the list moves, which is the point of the marks.
On a foreign target debugged with a suitable gdb, the same pane shows that architecture’s registers, because the list comes from gdb rather than from gdb-wui. See remote targets.
What the Registers tab does not do
- It does not switch format per register. Use
p/d $raxat the console. - It does not group or filter. The list is flat and complete, which on an architecture with several hundred registers is a long list.