Console, terminal and log
The three tabs along the bottom of the window show three different streams.
gdb console
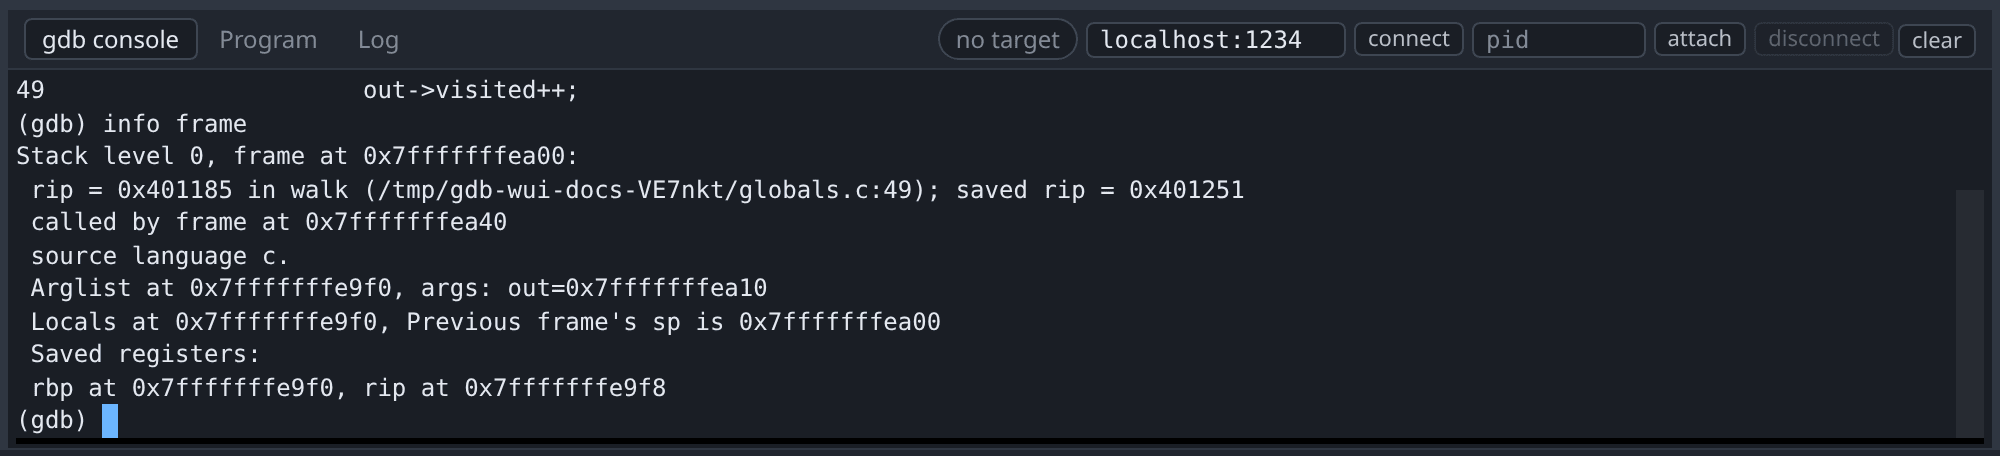
This is a real gdb console. Any gdb command can be typed into it, including everything gdb-wui has no buttons for: watch, condition, set var, info proc mappings, and commands you have defined yourself.
Tab completes, and ↑ recalls history.
Setting a breakpoint with break puts it in the Breakpoints pane, because that pane mirrors gdb rather than tracking what the UI did.
The console also works while the program is running, so it remains available in states the rest of the UI does not model.
Program
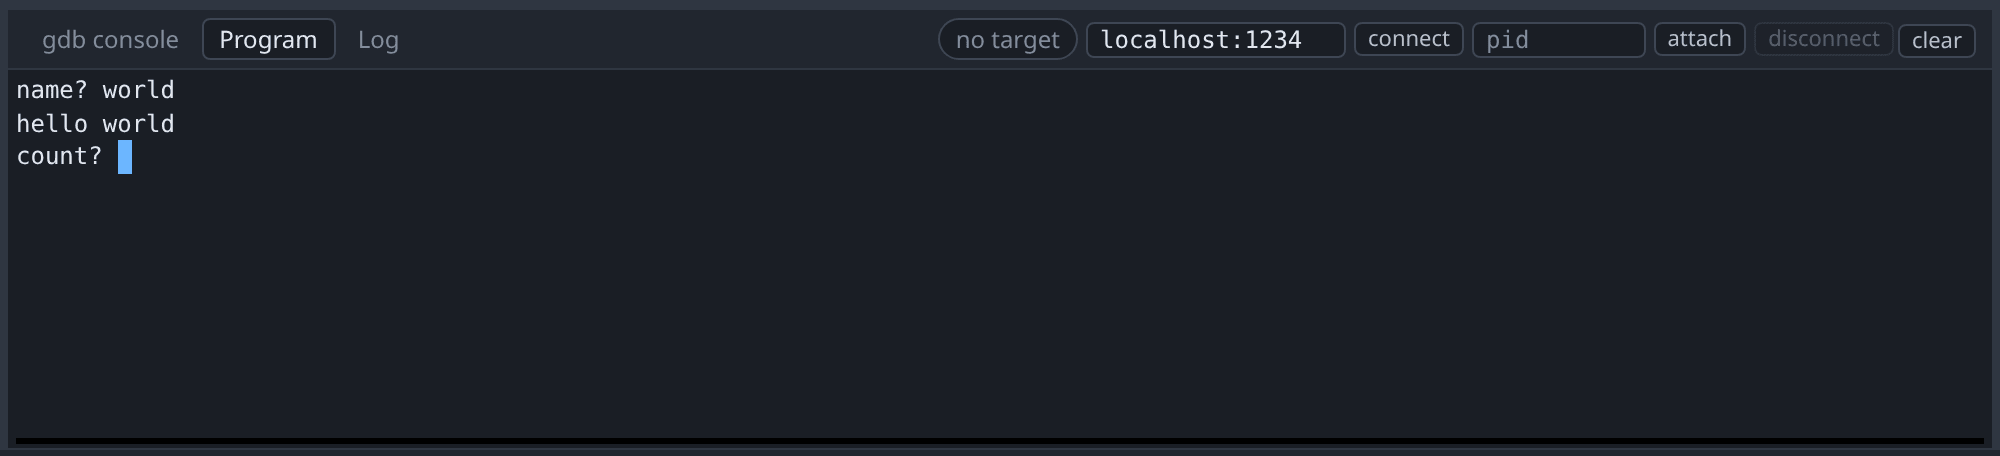
This tab is the terminal of the program being debugged. It is a pty rather than a pipe, which matters for buffering: printf("name? ") has no trailing newline, so on a pipe libc would block-buffer it and the prompt would not appear, while on a tty libc line-buffers and it appears immediately. The program therefore behaves as it does in your shell, and typing here reaches its stdin.
Inside a terminal panel, gdb-wui intercepts only the function keys and Ctrl+Shift+…, so Ctrl+C, Ctrl+D, Tab and the arrow keys all reach your program.
Log
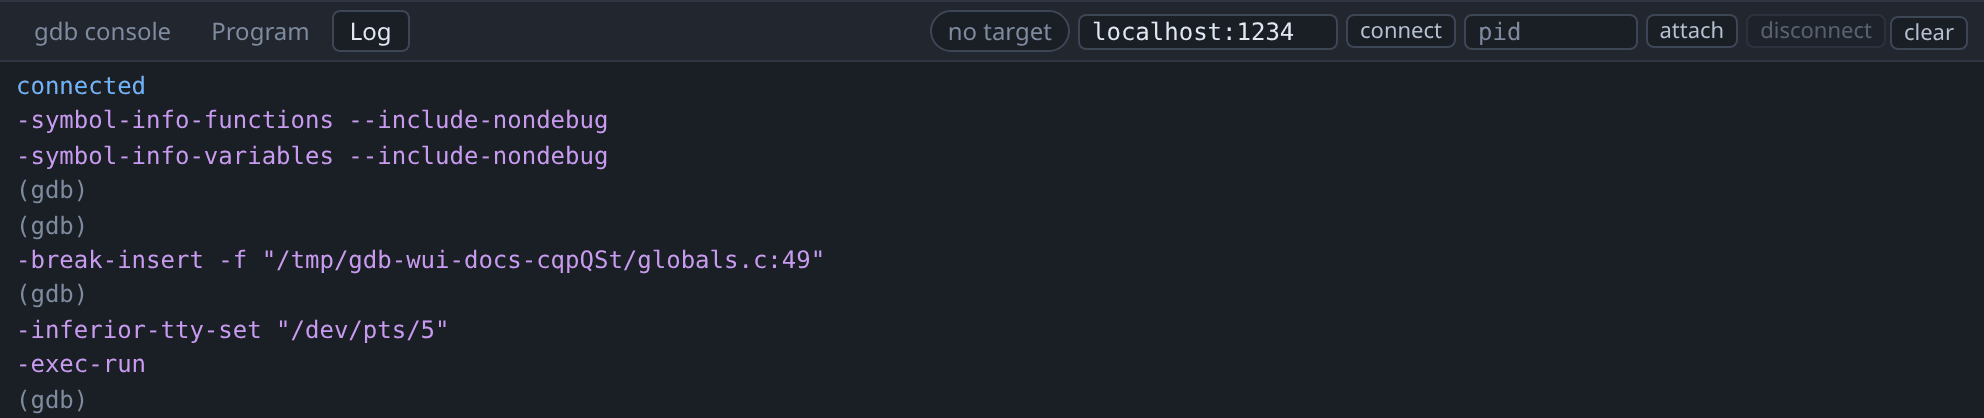
The Log tab shows diagnostics about gdb-wui itself, of three kinds:
- The decompiler’s activity, always. One line per operation, with timings; see decompilation.
- gdb’s own log stream, the messages that are not answers to a command.
- Raw GDB/MI traffic, only when gdb-wui is started with
-mi-log. Both directions are shown exactly as they went over the wire. This is behind a flag because it is every line of the conversation, rather than one line per operation.
Use -mi-log when the UI and gdb appear to disagree: it shows what was actually asked and actually answered.
Worked example
mkdir -p /tmp/tour && cp testdata/fixtures/globals.c /tmp/tour/
gcc -g -O0 -no-pie -o /tmp/tour/globals /tmp/tour/globals.c
./gdb-wui -project /tmp/tour -exe globals
Set a breakpoint on walk and press Run, then at the console:
(gdb) info frame
(gdb) p ratios
$1 = {1.5, 2.5, 3.5, 4.5}
(gdb) watch counter
Hardware watchpoint 2: counter
The watchpoint has no UI in gdb-wui, and it still appears in the Breakpoints pane, labelled counter with no address, because gdb announces it with the same =breakpoint-created it uses for breakpoints. You can disable and delete it from the pane like anything else.
What the console, terminal and log do not do
- The Program tab is not a full terminal emulator. Line-oriented programs work; a curses application will not render correctly.
- The console adds no scripting or macros beyond gdb’s own.
- The Log tab does not filter or search. It keeps a bounded number of lines and drops the oldest.