A first session
This walks through loading a program, setting a breakpoint, inspecting a value and finding it in memory. It takes about five minutes and uses a program in this repository, which is also the program every screenshot on this site was taken from.
Build a program to debug
testdata/fixtures/globals.c is a small program with named globals: a counter, a string, an array of doubles, a static, and a two-node linked list.
mkdir -p /tmp/tour && cp testdata/fixtures/globals.c /tmp/tour/
gcc -g -O0 -no-pie -o /tmp/tour/globals /tmp/tour/globals.c
The source is copied into /tmp/tour and compiled there, rather than compiled where it sits, because a binary records the path its compiler was given. Build it from testdata/fixtures/globals.c and that is the only name gdb has for the file, which is not a path under -project — so the file tree has nothing to click and a breakpoint on the file you can see is refused. Every example in this documentation copies first for that reason; see No source file named ….
Build it with -no-pie so that the addresses shown below are the ones you will see. A position-independent executable is relocated at load time, so its addresses differ on every run. gdb-wui handles that, but it makes a tutorial harder to follow.
Start gdb-wui
go build ./cmd/gdb-wui
./gdb-wui -project /tmp/tour -exe globals
gdb-wui prints a URL on stdout and opens a browser at it. If no browser opens — over SSH, in a container, or with no desktop session — copy the URL into a browser yourself. The URL works the same however you open it.
The status bar at the bottom of the window should read connected and name your gdb.
Set a breakpoint and run
Click globals.c in the file tree, then click line number 49, which is out->visited++; inside walk. A red dot appears in the gutter, and the breakpoint also appears in the Breakpoints pane on the right. These are two views of the same breakpoint.
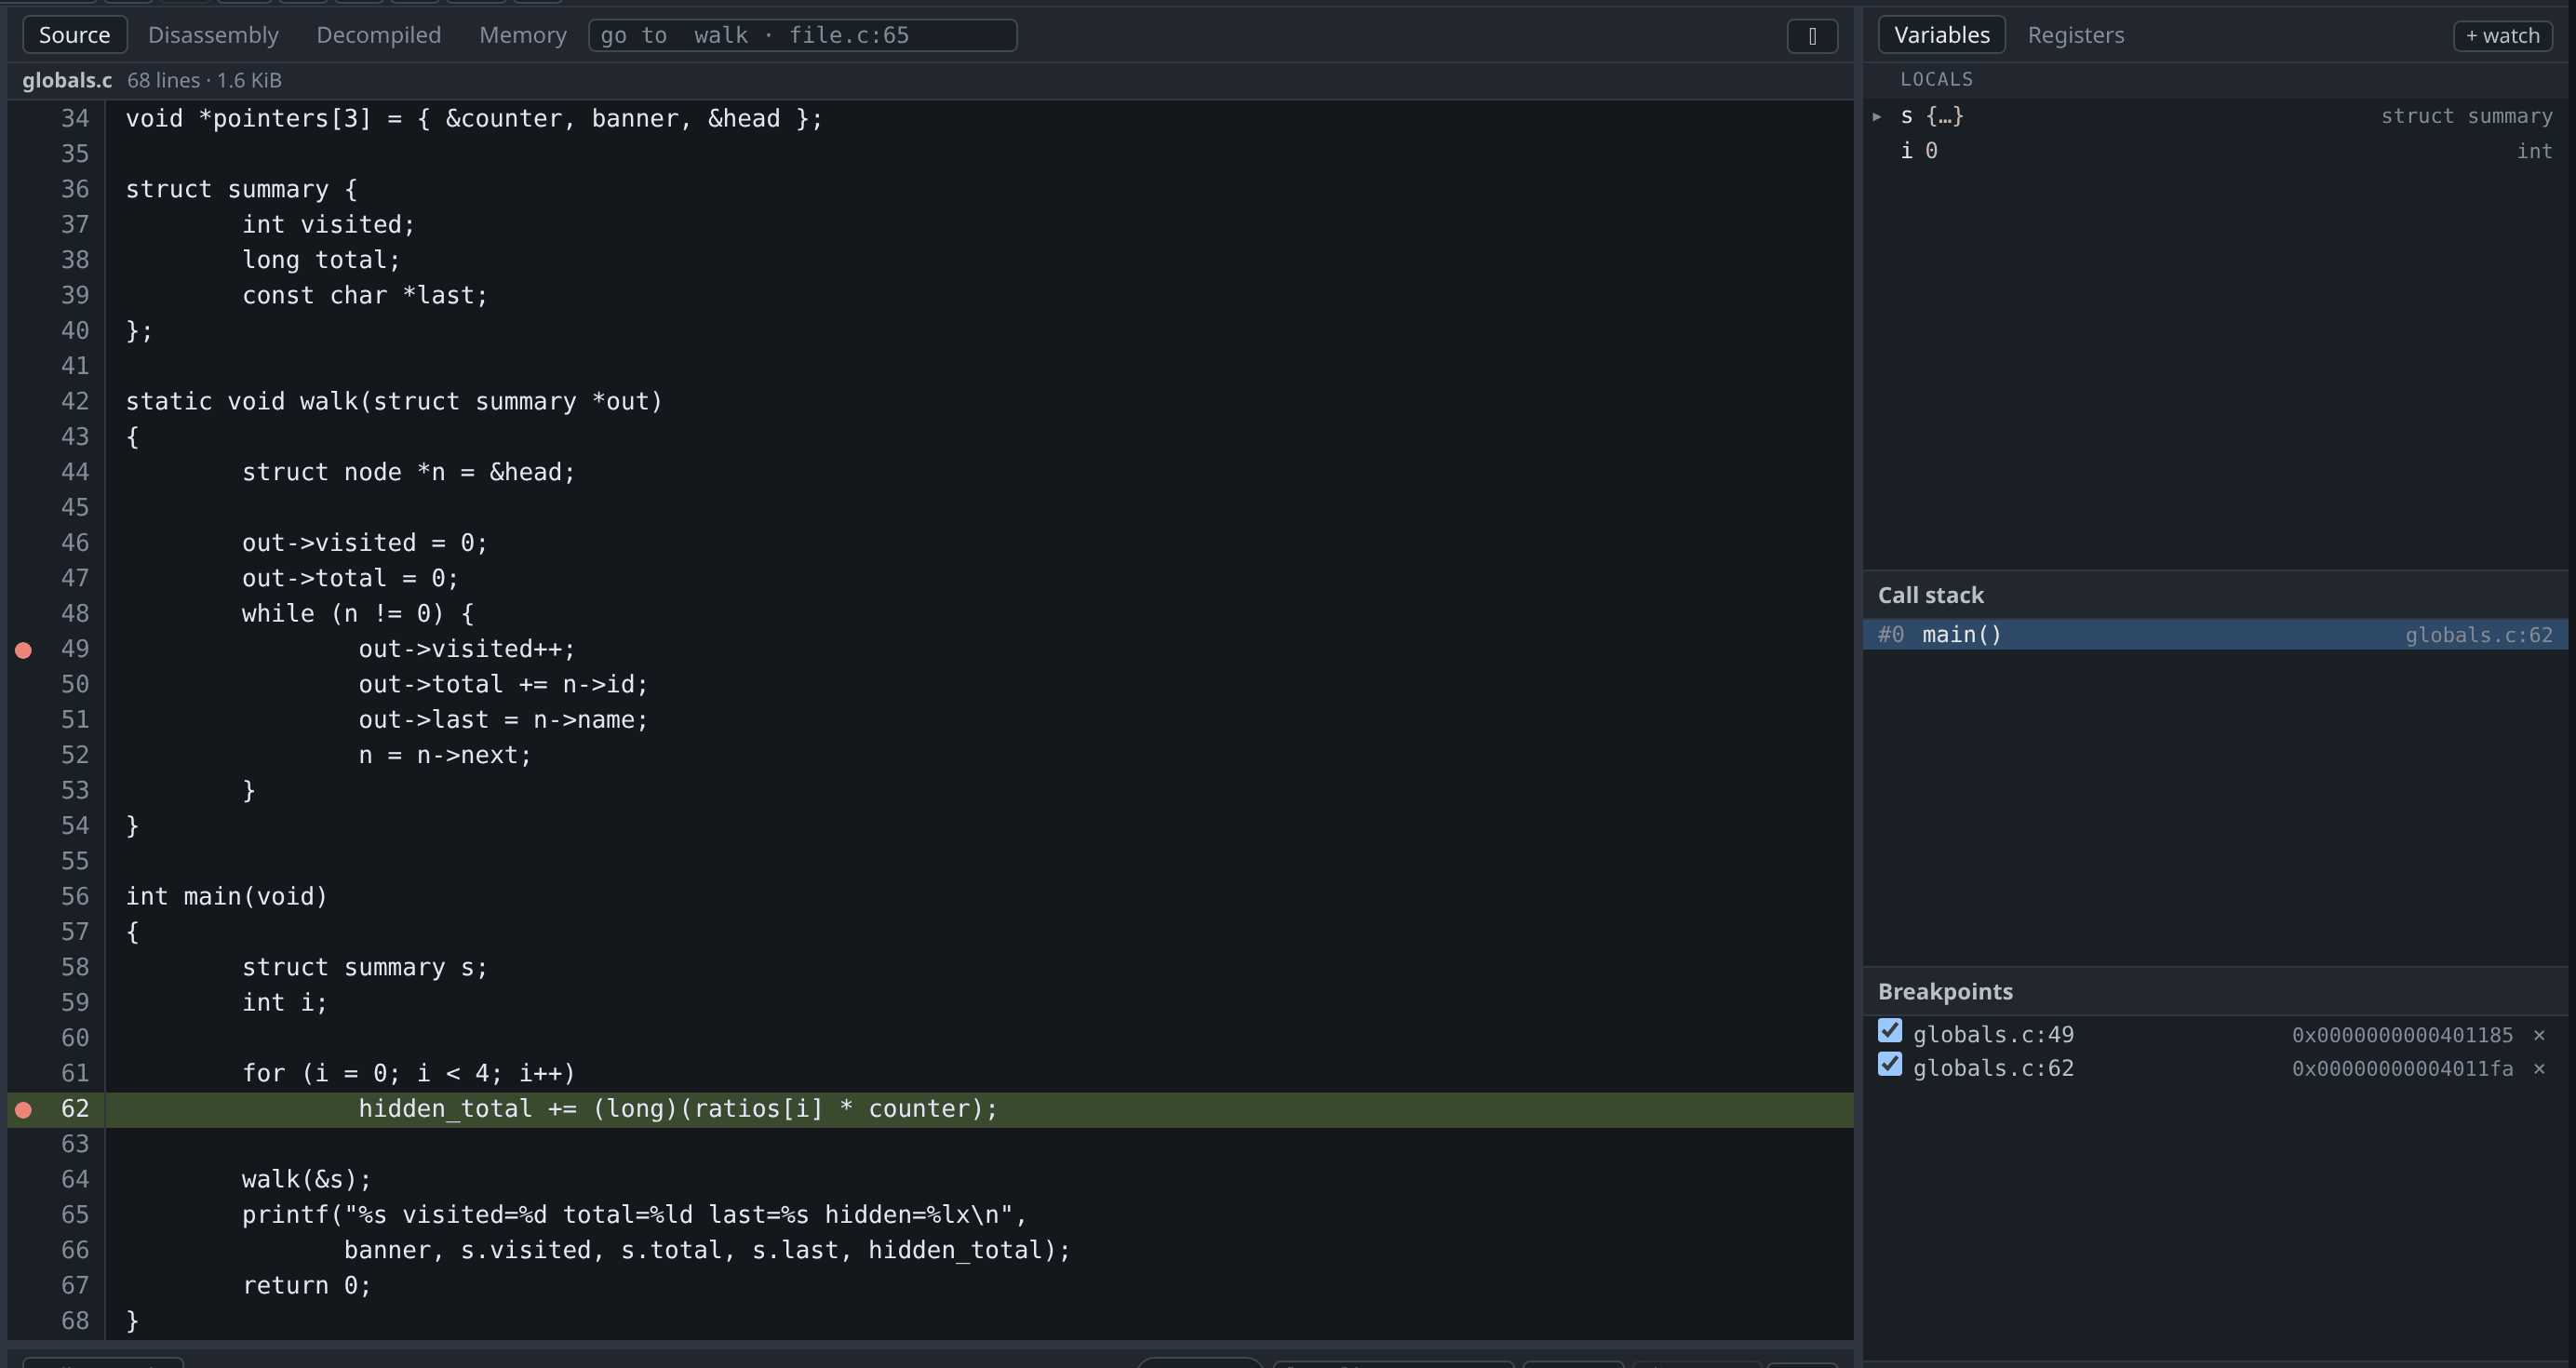
Press Run in the toolbar, or Ctrl+F5.
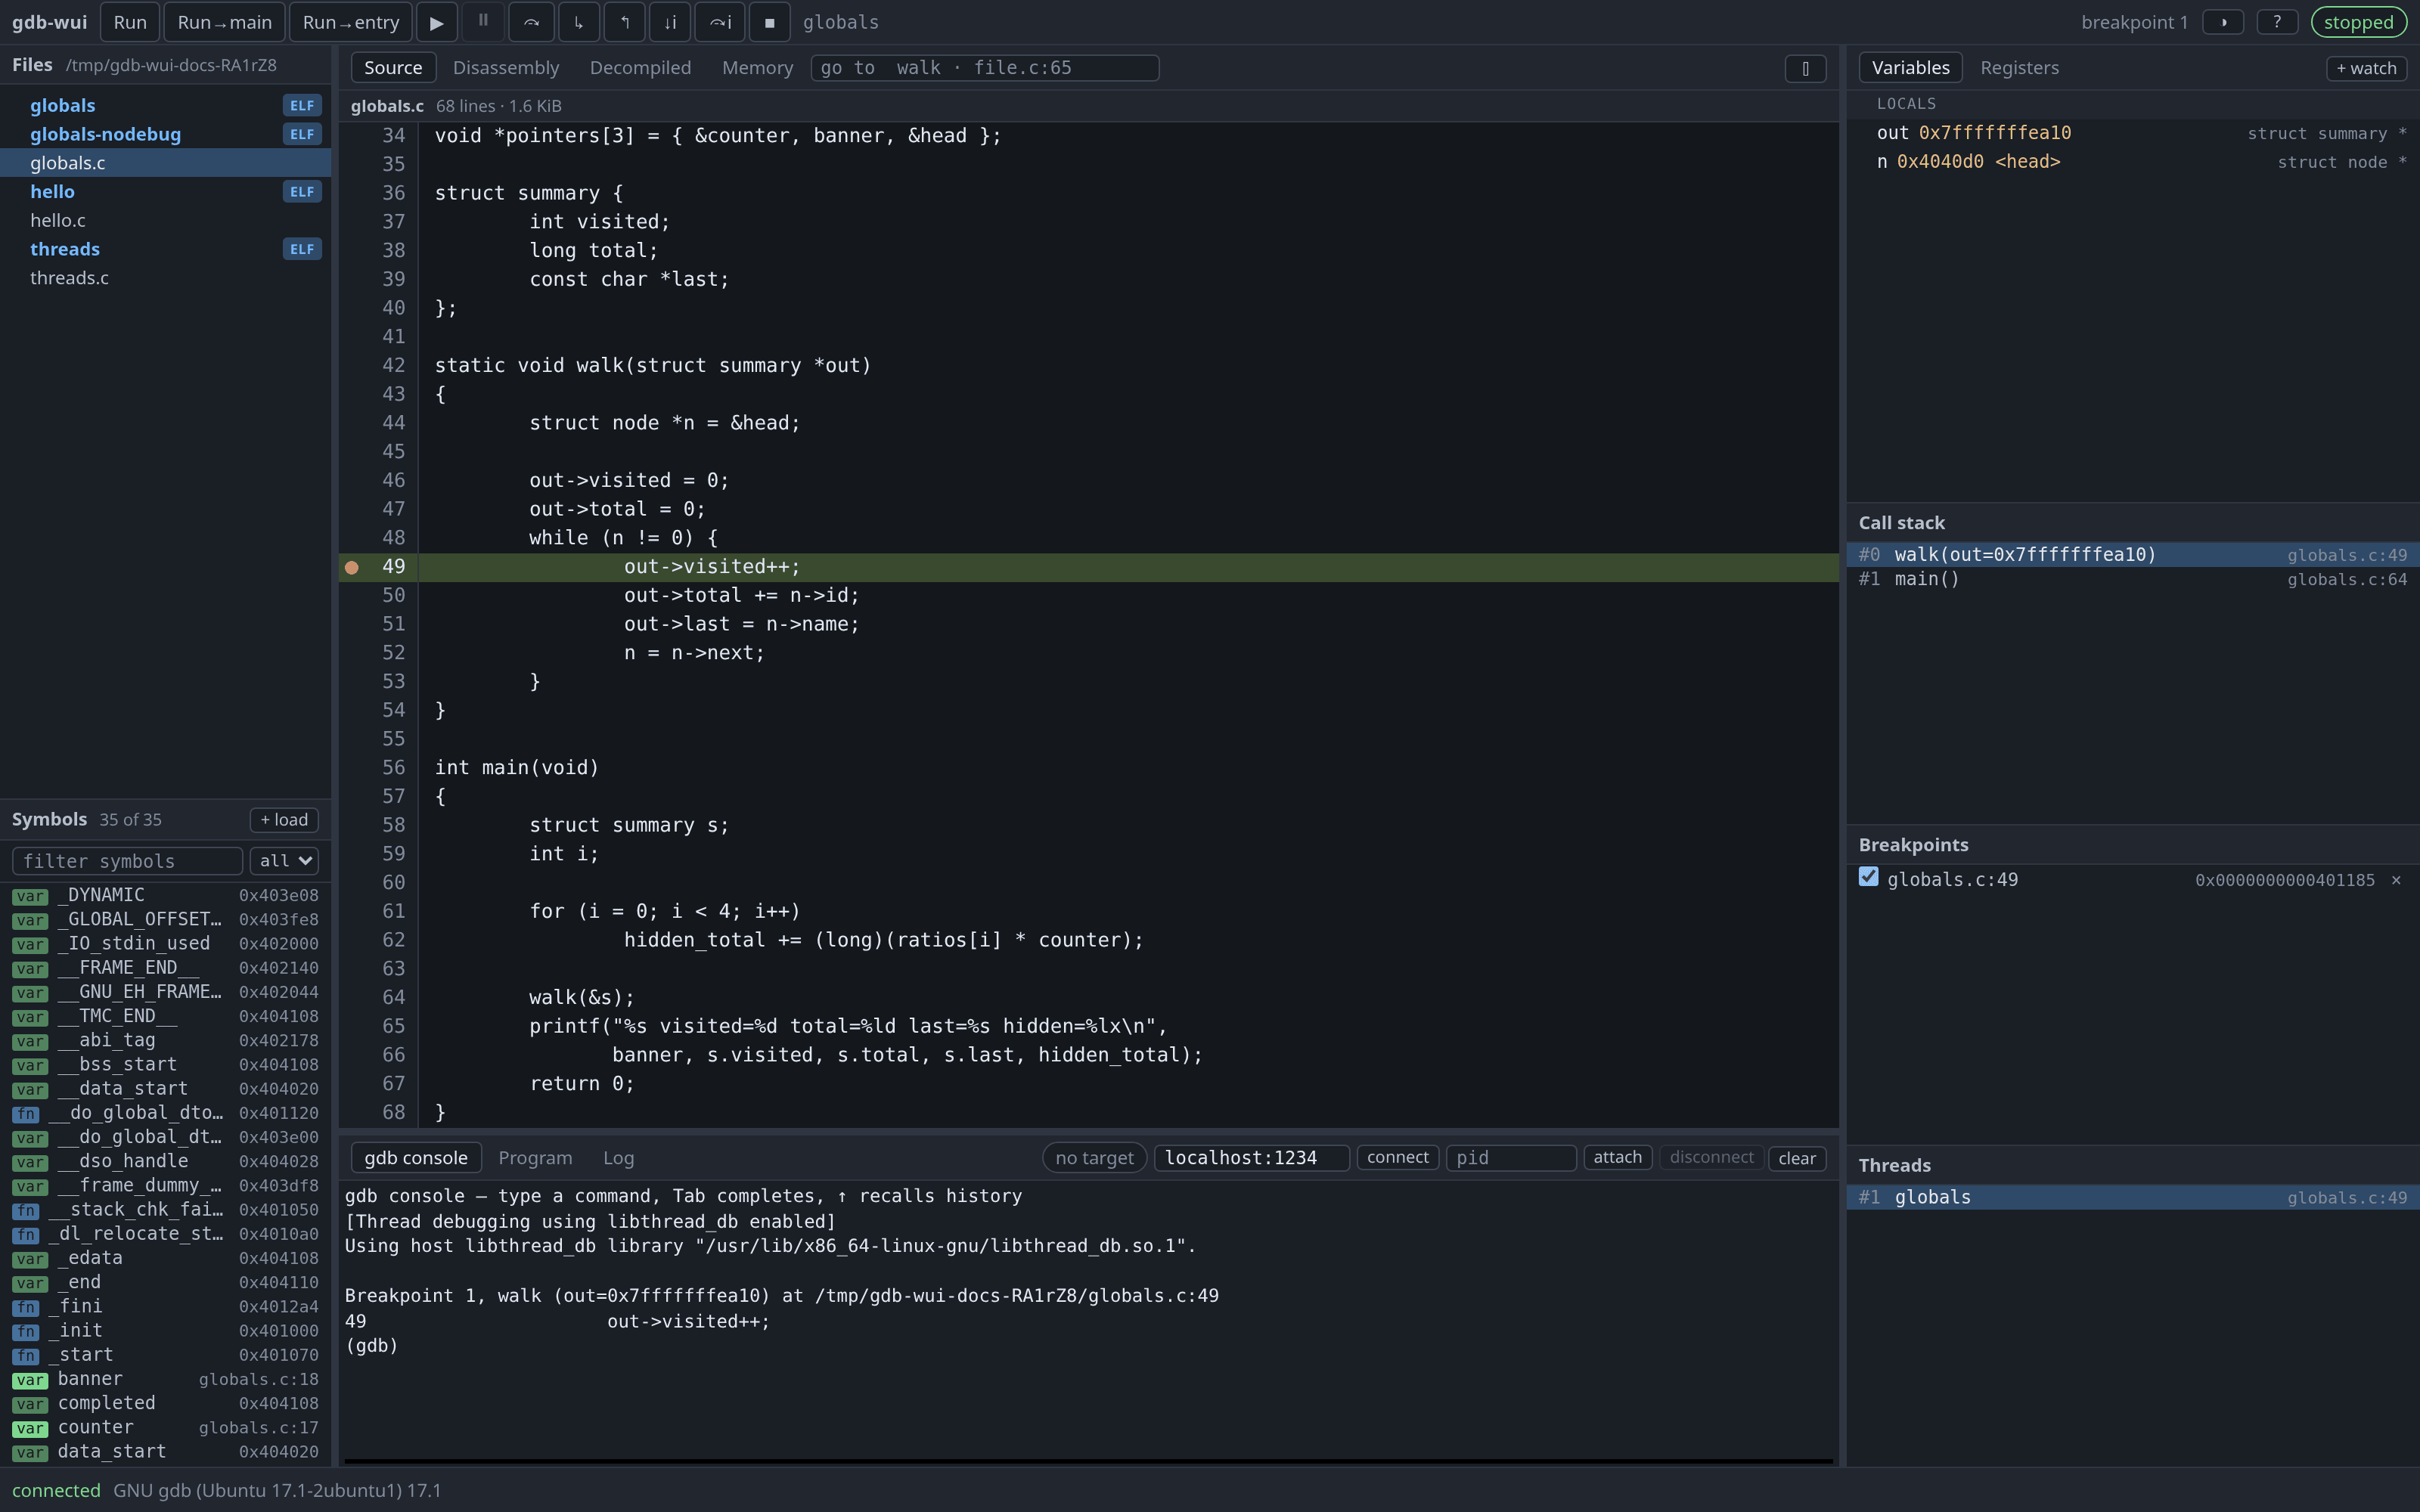
Every pane now has something in it:
- The green bar in the source view is the program counter, on line 49.
- Locals shows
outandn: the parameter, and the cursor into the list. - The Call stack has two frames,
walkcalled frommain. Clicking#1 main()moves a blue bar to the calling line and leaves the green bar where it is, so you can inspect a caller without losing sight of where the program stopped. - The gdb console shows the stop as gdb reported it. It is a real gdb console, so you can type any gdb command into it.
Read a value by hovering
Rest the pointer on n->name on line 51.

gdb-wui reads the whole expression, not the word under the pointer, so you get the name field of the node n points at rather than something else called name.
Only names, fields and subscripts are evaluated.
f(x)is not, because gdb would answer it by callingfin the program being debugged, which should not happen because a pointer moved across the screen.
Follow the value into memory
Right-click the same expression.
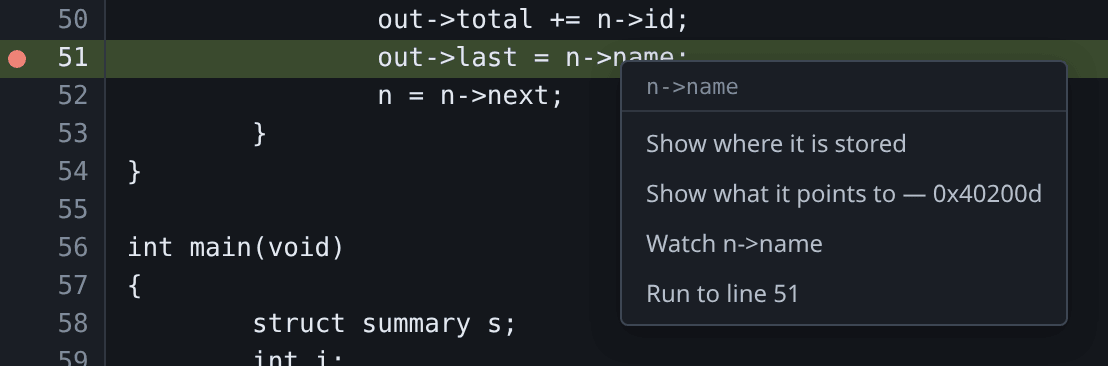
The two memory entries are different things, and the menu names the address each one would show:
- Show where it is stored — the address of the pointer variable itself.
- Show what it points to — the address it holds,
0x40200dhere.
The other two are about the line and the expression rather than the memory behind them: Watch keeps the value in the Variables pane, and Run to line 51 runs the program to this line and stops.
Choose the second. The Memory tab opens at that address. Now type &counter into the address box at the top and press Enter; the box takes an expression, not only a number.
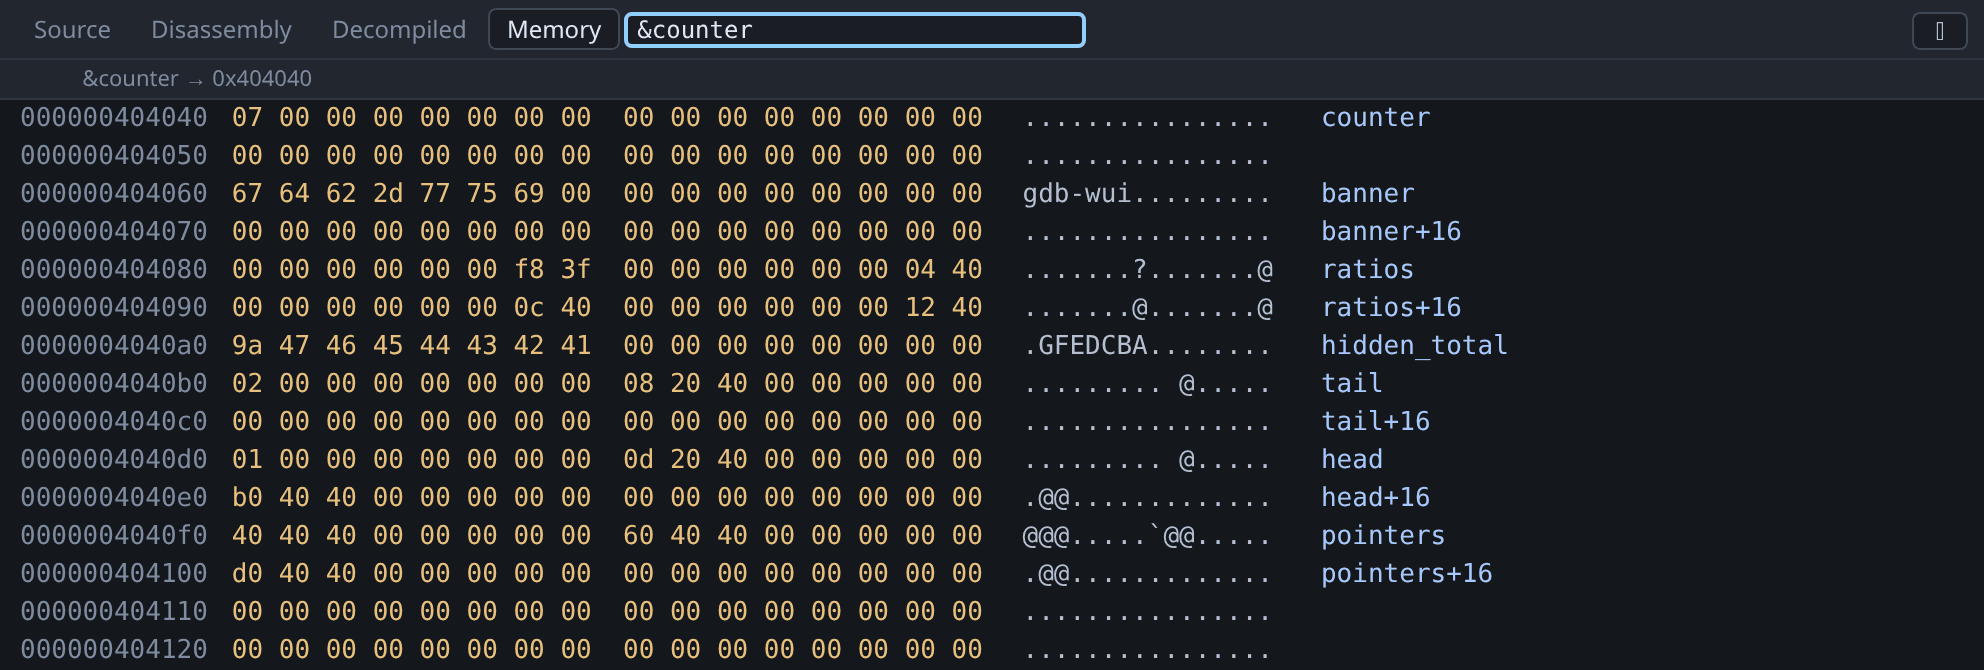
The right-hand column names the symbol each row falls in, so you see banner+16 rather than an address you have to work out. Rows that belong to no symbol — padding here, and the stack and heap elsewhere — are left blank rather than guessed at.
You can read the program’s data straight off this view:
counteris07.bannerspellsgdb-wuiin the ASCII column.hidden_totalis the0x4142434445464748from the source, stored little-endian, with9ain the low byte becausemainhas already added to it.headat0x4040d0holds01, then a pointer to0x40200d— the string"head"you hovered a moment ago.
Step
F10 steps over, F11 steps into, and Shift+F11 runs to the end of the current frame.
Hold F10 down to walk the marker through the loop. The Locals pane and the tooltip follow, and the tooltip closes as soon as the program moves, so it cannot show you a value from the previous stop.
Go somewhere else
Type walk into the box at the right of the tab strip and press Enter. The source view opens at the function. Ctrl+Shift+G puts the cursor in that box, and it also takes an address, a globals.c:65, or a bare :65 for a line in the file already open.
Now click the Disassembly tab and type walk again: the same word, and this time you get its instructions. The box acts on whichever view you are looking at. See jumping to a file, symbol or address.
Change a value
Double-click a value in the Locals pane, type a new one, and press Enter. It is written through gdb, so the program goes on with what you typed. The same works on a register and on a byte in the hex view.
To watch that change the program’s output, the editing page breaks on line 65 instead, sets s.visited to 7, and the printf on that line prints visited=7 rather than the 2 it counted.
Next
- Try the same program with the debug info removed, to see what the Symbols pane and the Decompiled tab are for.
- Attach to a program that is already running:
testdata/fixtures/tracee.cis there to be attached to, and remote targets walks through it. - Read remote targets if the program you want to debug is not on this machine, or is for another architecture.
- Look up the keyboard shortcuts.