Symbols
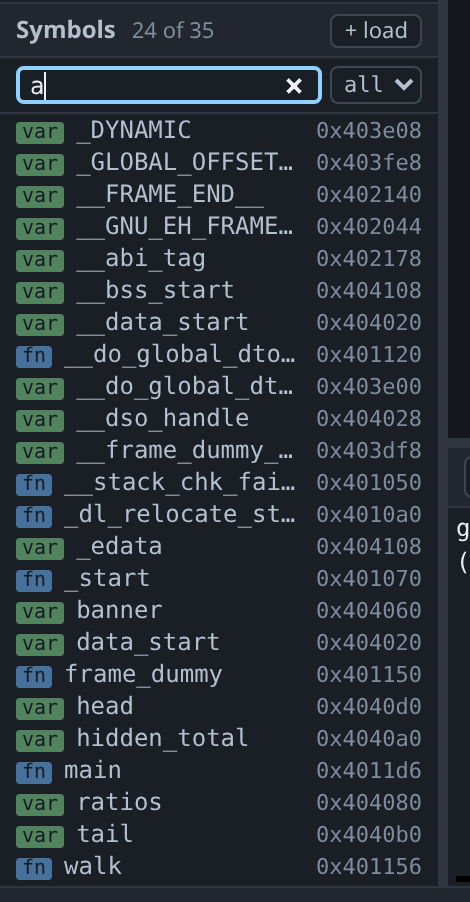
The Symbols pane lists every function and global in the loaded program, taken from debug info if there is any and from the ELF symbol table if not. On a release build that table is the only map the program carries, and this pane is how you read it — and when even that is gone, the pane fills from the decompiler instead.
The filter box matches substrings. The fn and var sigils show which kind each symbol is, the all dropdown narrows the list to one kind, and dimmed rows are symbols with no debug info, so you can see how much of the program has usable type information.
Double-clicking a symbol jumps to it:
| Symbol | Goes to |
|---|---|
| A function with debug info | Its source line |
| A function with only an address | The disassembly |
| A variable with only an address | The memory viewer |
Right-clicking a symbol offers Set breakpoint and Go to.
Listing a stripped binary’s functions
Configure the decompiler and the pane fills from Ghidra’s names instead. Without it a stripped binary has nothing to list, which is the program you most needed the list for:
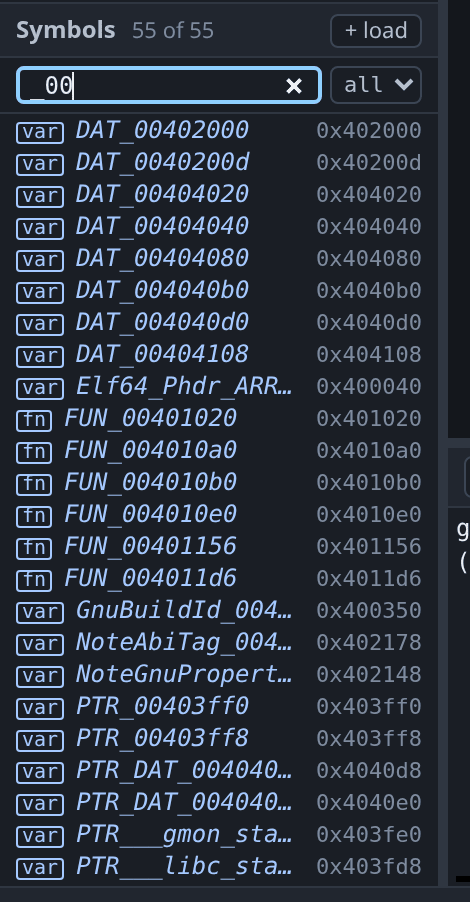
FUN_0010e2dcfor every function Ghidra recovered, listed asfn.DAT_001a08defor every global something references, listed asvar, with its type when one has been applied.- Whatever you have renamed either of those to, since that is the name you will go looking for.
These rows are drawn differently — the same italic that the call stack uses for a recovered frame — because they are not symbols. FUN_0010e2dc is a guess about where a function starts, and a name you typed over one is a guess you agreed with; neither is recorded anywhere in the program, and a list that showed them like the binary’s own would be claiming something the binary does not say. Where the binary does have a name, the binary’s wins and appears once.
Everything else works the same. Double-clicking goes to the disassembly or the memory viewer, right-clicking sets a breakpoint, and the name can be typed into the go-to box — or right-clicked where you found it, in the decompiled text. gdb has never heard of any of them, so the server resolves the name through Ghidra and translates the address — which is not the number spelled out in the name, since a position-independent executable is somewhere else entirely by the time it is running.
One difference worth knowing: a breakpoint on a decompiler name stops at the function’s first instruction, where a named function would have had its prologue skipped. On a stripped binary that is arguably the better place — the arguments are still in the registers the ABI put them in, before anything spills them.
Until Ghidra has finished analysing, the pane says so rather than saying the program has no symbols. On firmware that wait is minutes.
Loading more symbols
To load a symbol file for the program already running, click + load.

Choose replace to run symbol-file, which replaces the symbols you have. Choose add to run add-symbol-file, which reveals an offset field.
Use the offset when the image does not run where it was linked — a firmware blob relocated by a bootloader, or a module mapped at a base chosen at load time. Enter the difference between the two addresses and the symbols line up again. If the offset is wrong, every symbol is wrong by the same amount, which shows up as names appearing against the wrong code.
Loading symbols does not set the architecture; only loading the program does, because only
filereads the ELF header. Loading symbols for the wrong architecture gives you correct-looking names over disassembly that is not meaningful. Load the program by clicking its ELF in the file tree first. See remote targets.
Worked example
Build the same program with the debug info removed but the symbol table left alone, which is what a release build looks like:
mkdir -p /tmp/tour && cp testdata/fixtures/globals.c /tmp/tour/
gcc -g -O0 -no-pie -o /tmp/tour/globals-nodebug /tmp/tour/globals.c
objcopy --strip-debug /tmp/tour/globals-nodebug
./gdb-wui -project /tmp/tour -exe globals-nodebug
walk, main, counter, banner, head and hidden_total are all still listed, and all dimmed, because gdb knows where each one is but not what type it is. Right-click walk and set a breakpoint; it works as it would with debug info.
The missing type information shows up when you read a value at the console:
(gdb) p counter
'counter' has unknown type; cast it to its declared type
(gdb) p (int)counter
$1 = 7
The memory viewer needs no type at all, which makes it the easier tool here, and its symbol column is populated from this same table.
What the Symbols pane does not do
- It lists functions and variables only. Types, macros, files and gdb’s other symbol domains are not shown; use
info typesat the console. - It does not control demangling. Names are as gdb reports them, so gdb’s demangler settings apply.
- It does not search by address. Enter the address in the memory viewer or the disassembly instead.