Breakpoints
To set a breakpoint on a source line, click the line number.
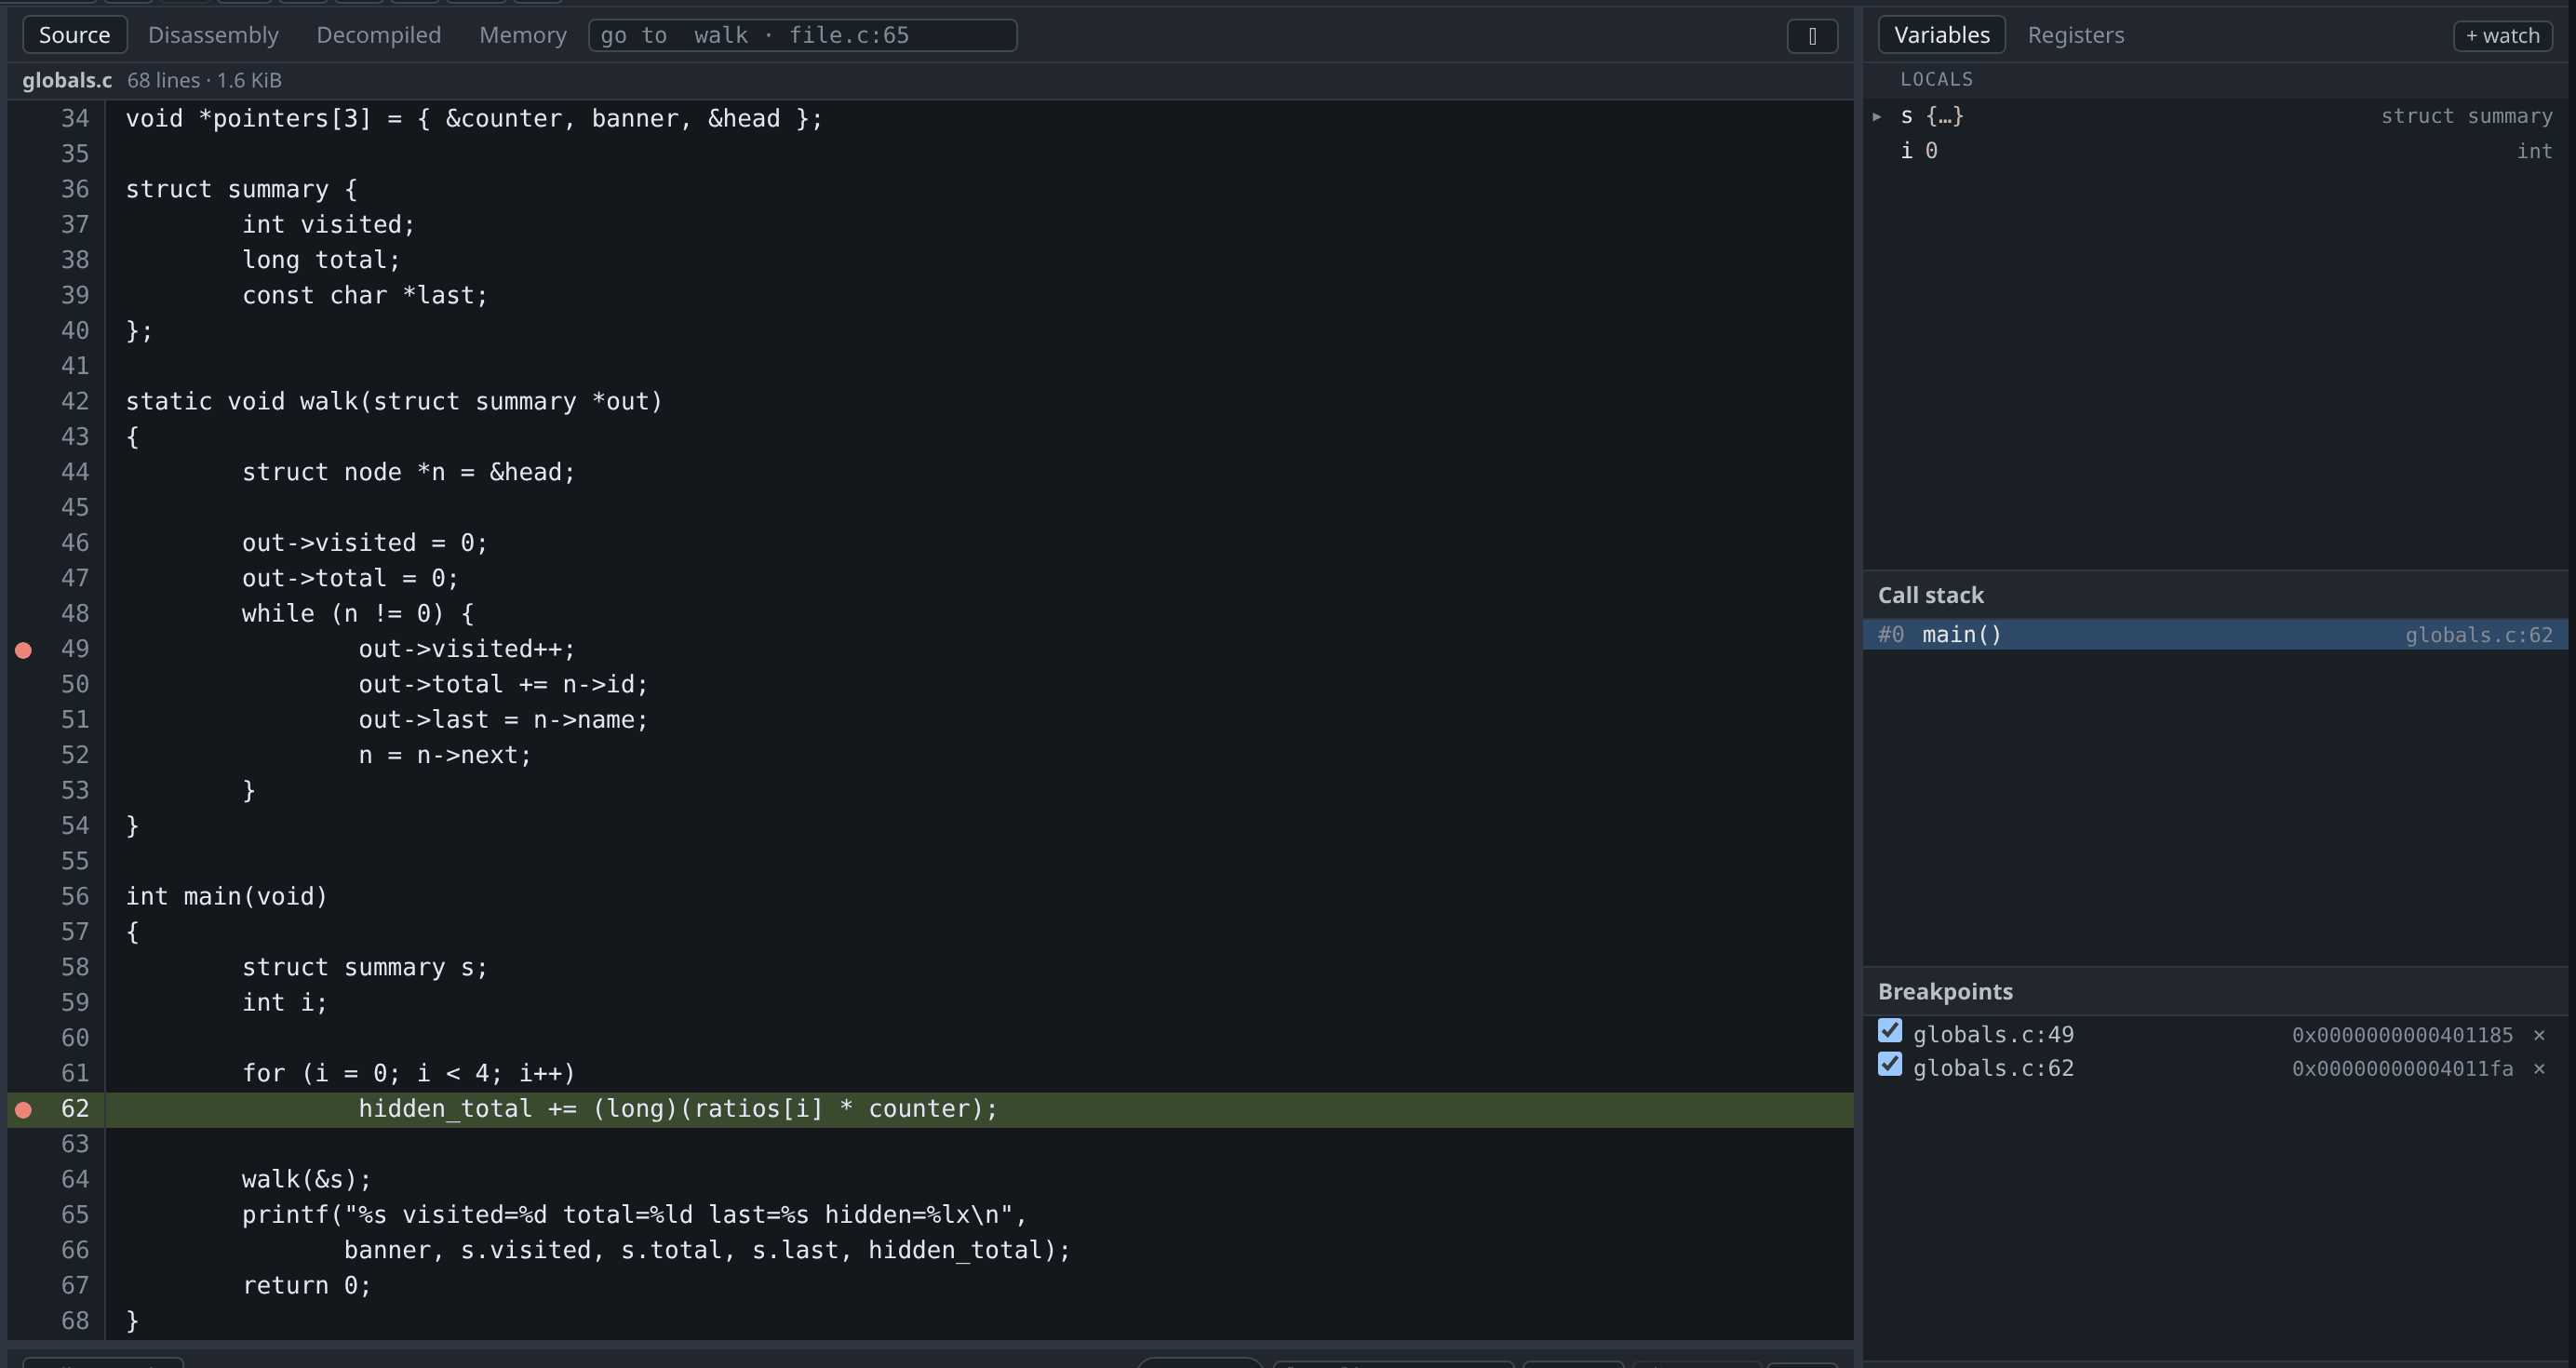
The dot in the gutter and the row in the Breakpoints pane are the same breakpoint shown twice; the pane mirrors what gdb holds rather than tracking what the UI did. To remove a breakpoint, click the gutter again, or click the × in the pane. To disable one without deleting it, clear its checkbox.
The gutters in the disassembly and decompiled views work the same way, except that they set a breakpoint on an address rather than on a line.
Breaking on a function with no source
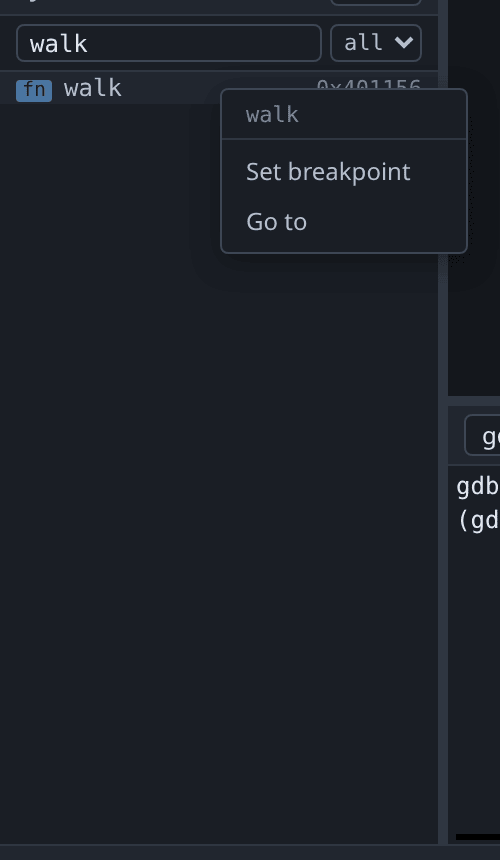
To break on a function when you have no source for it, right-click the function in the Symbols pane and choose Set breakpoint.
Breaking by name and breaking at an address
Breaking on a function by name and breaking at its address stop at different instructions.
When you give a name, gdb skips the function prologue, using the line table or a heuristic to find the first instruction after the frame is set up. On a MIPS firmware, for example, break process_packet stops at entry+24, after the register spills. Use this when you want to inspect arguments and locals, because by then they have been stored somewhere you can read.
When you give an address, gdb stops exactly there. At a function’s entry that is before the frame exists and before any argument has been stored, so the Variables pane will show values that are not yet meaningful. Use this when you want to see the prologue itself, or to catch a jump into the middle of a function.
| To do this | Use |
|---|---|
| Inspect arguments and locals | The name; let gdb skip the prologue. |
| See the prologue, or catch a jump into a function | The address. |
A decompiler name — FUN_0010e2dc, or whatever you have renamed it to — works here too, and behaves like the address rather than like the name: gdb has never heard of it, so the server resolves it through Ghidra and breaks on the entry instruction. On a stripped binary that is often where you want to be anyway. There is no prologue to skip past to — no line table and no locals to wait for — and the arguments are still in the registers the calling convention put them in, which on that binary is the only place you were going to read them.
Set one before the program has started and it is listed as pending until the program is loaded. A position-independent executable — what gcc builds by default — runs somewhere other than the addresses Ghidra knows it by, and where is only known once it is loaded; a breakpoint placed at the address Ghidra gives would be in the wrong place. So a run with one of these starts at the program’s first instruction, places it at the address the program was loaded at, and carries on to wherever you were running to. Run→entry stops there as usual, with the breakpoint already placed.
How breakpoints are named
Each row is named the best way anything can name it: a file and a line where there is debug info, a function name where gdb has one, and otherwise the address, which is all a stripped binary offers.
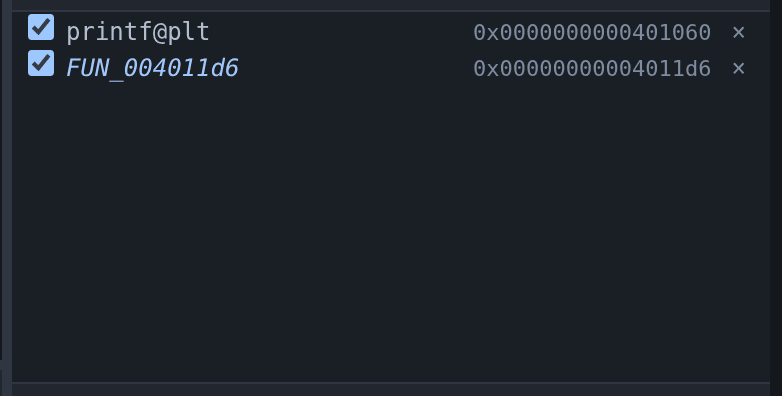
With the decompiler configured, an address is no longer the end of it. A breakpoint gdb could not name is looked up in Ghidra and the row takes that name, with +0x1c when it is partway into a function — the same treatment, and the same italics, as a recovered frame in the call stack. The address stays in the second column, because that number is what you check against the disassembly.
printf@plt above is the control: gdb named that one out of the binary’s dynamic symbol table, and Ghidra calls the thunk there printf as well. A row gdb can name keeps gdb’s name and stays unmarked, because a fact and a recovery should not look alike.
Pending breakpoints
A breakpoint on a file or symbol that gdb does not yet know about is accepted and marked pending. It resolves when a shared library loads, or when a program is loaded. The Breakpoints pane shows pending breakpoints differently so that you can tell an unresolved breakpoint from one that will be hit.
Temporary breakpoints
Run to a line puts one in: a breakpoint gdb deletes the moment it is hit. It appears in the pane while it lasts, because one you cannot see is one you cannot cancel — and if the program never reaches it, it stays there to be deleted like any other.
Unlike an ordinary breakpoint, a temporary one is never made pending. A location gdb cannot resolve is reported as an error rather than accepted, because a run-to that resolves to nothing would run the program to completion instead of saying it could not find the place.
Worked example
mkdir -p /tmp/tour && cp testdata/fixtures/globals.c /tmp/tour/
gcc -g -O0 -no-pie -o /tmp/tour/globals /tmp/tour/globals.c
./gdb-wui -project /tmp/tour -exe globals
Click line 49. Then set the same breakpoint both other ways at the gdb console and compare the addresses:
(gdb) break walk
Breakpoint 1 at 0x401162: file globals.c, line 44.
(gdb) break *walk
Breakpoint 2 at 0x401156: file globals.c, line 43.
They are twelve bytes and one line apart. Breakpoint 2 is on the opening brace, before out has been stored anywhere; breakpoint 1 is on the first statement, where the parameter can be read. Both appear in the Breakpoints pane with their addresses beside them.
What breakpoints do not do
- Watchpoints, catchpoints and tracepoints have no UI. gdb supports all three, and they work when typed into the console; a watchpoint set that way even appears in the Breakpoints pane, because gdb announces it the same way it announces a breakpoint.
- Conditions and hit counts have no UI either. Use
conditionandignoreat the console; they apply to a breakpoint set by clicking.