Source and files
The file tree shows the directory given as -project and nothing outside it. Paths are resolved against the project root and any path that escapes it is refused. Executables are marked with an ELF badge.
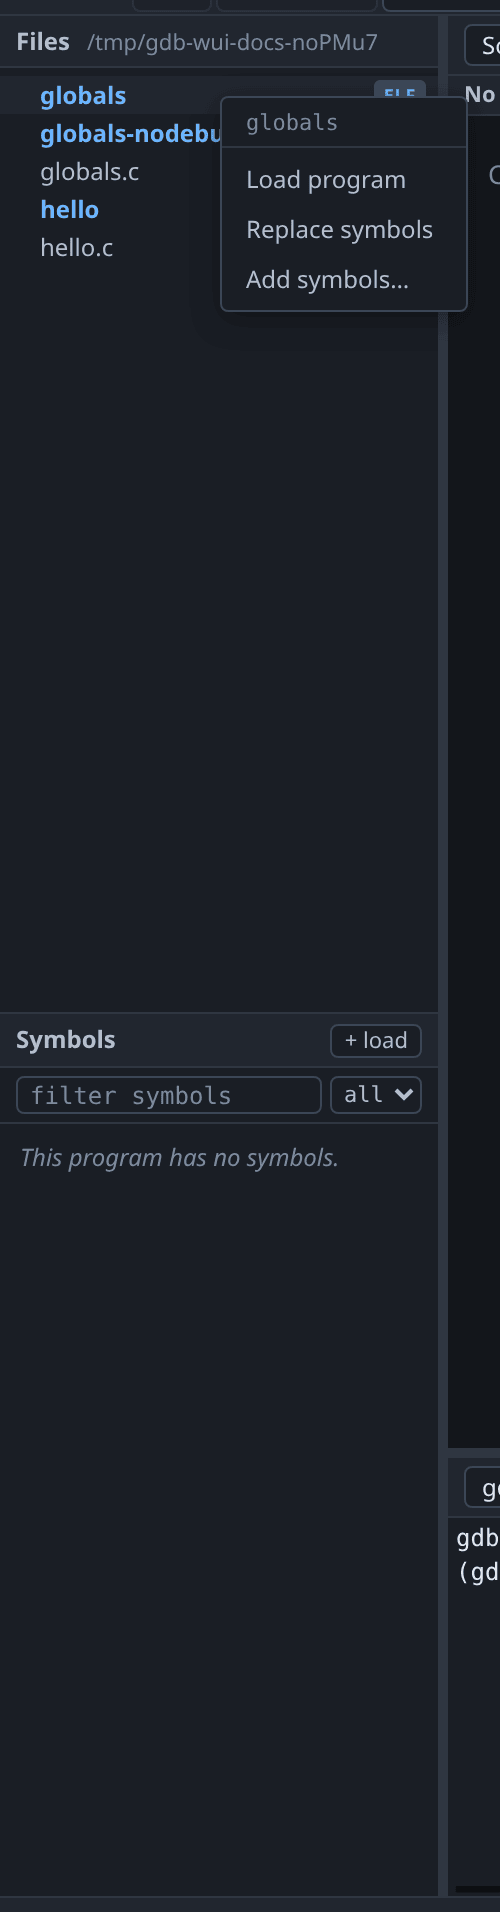
To use an executable, right-click it. The three menu entries do three different things:
| Menu entry | gdb command | What it does |
|---|---|---|
| Load program | file | Sets the program to run. This is the only one that sets the architecture. |
| Replace symbols | symbol-file | Replaces the symbols for the program already loaded. |
| Add symbols… | add-symbol-file | Adds more symbols, at an offset you supply. |
Left-clicking an ELF loads it as the program. If a program is already being debugged, gdb-wui asks first, because loading a program replaces the inferior and would otherwise discard a live session on a stray click.
Loading symbols does not set the architecture; only
filedoes, by reading the ELF header. Measured against gdb 17.1 with a MIPS64 image:filesets the architecture tomips:octeon/big, whilesymbol-fileandadd-symbol-fileboth leave gdb at the host’si386. This is easy to miss, because the Symbols pane fills with correct names either way. See remote targets.
The two line markers
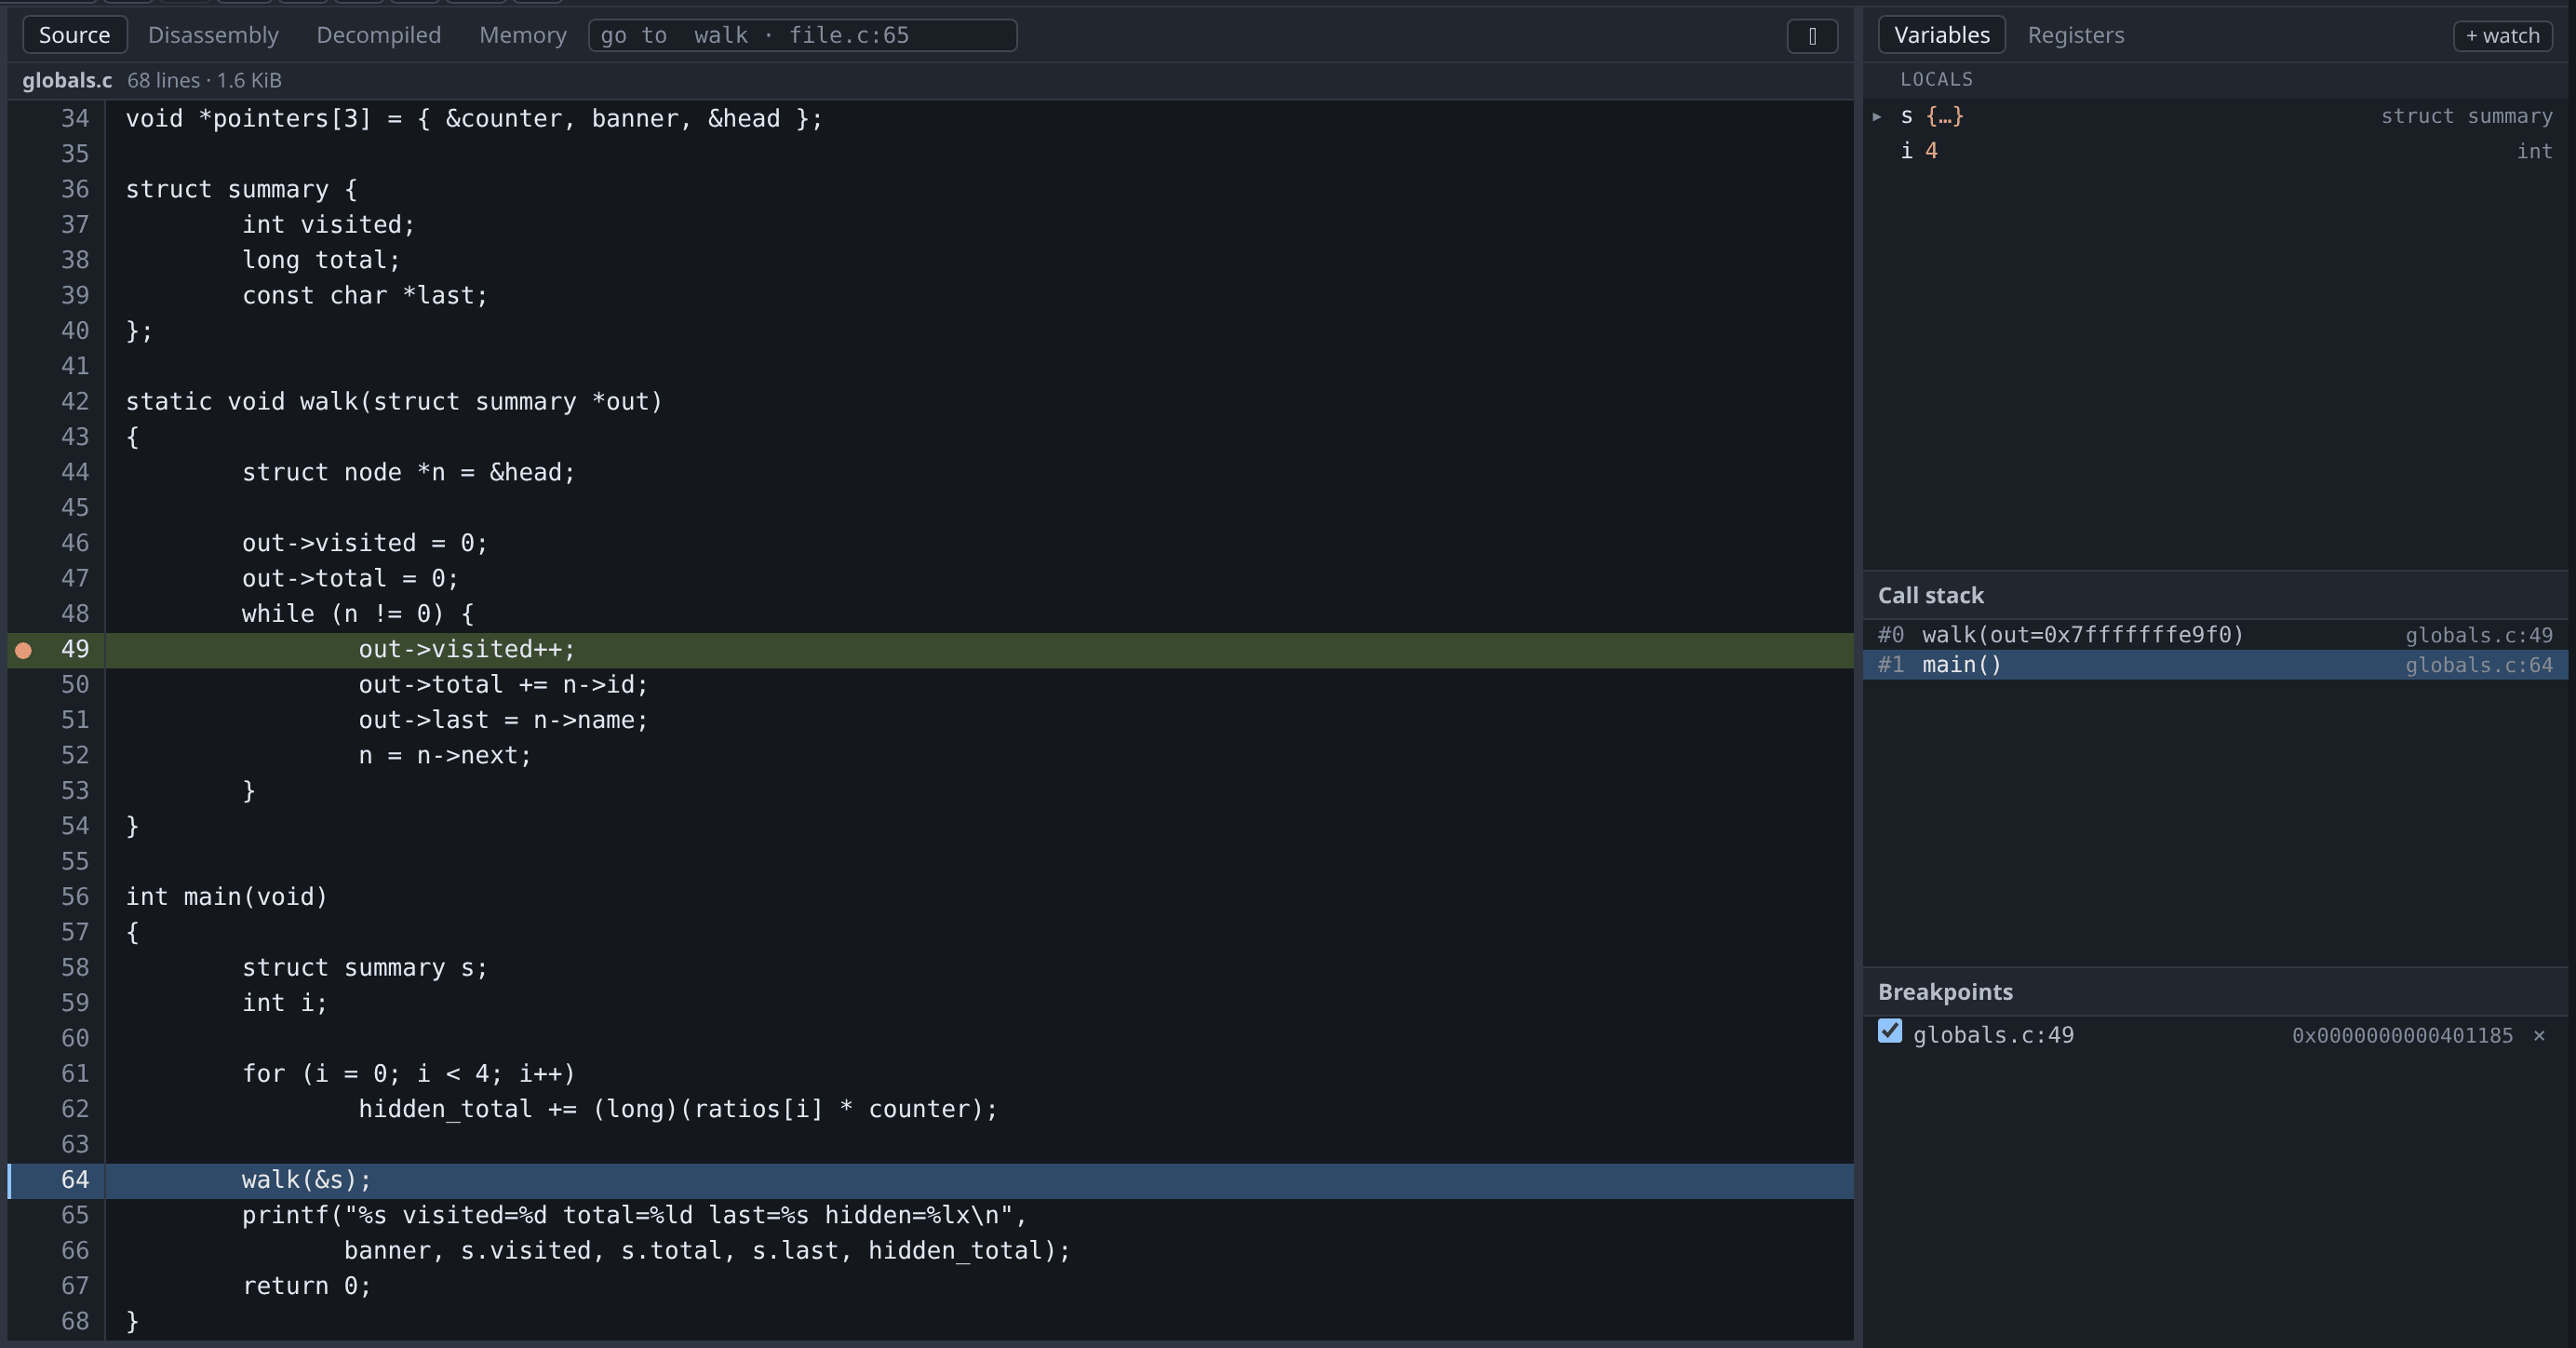
The green bar is the program counter: where the program is now. The blue bar is the line of an outer frame you have selected in the call stack.
They are kept separate so that selecting a caller does not move the “executing here” marker onto code that is not executing. In the screenshot, selecting frame #1 main() puts the blue bar on line 64 and leaves the green bar on line 49.
Every value you read — the Variables pane, and hover tooltips — comes from the selected frame, so the markers also tell you which frame the values belong to.
Two views at once
To show two of the four centre views together, press the split button at the right of the tab strip, or F7.
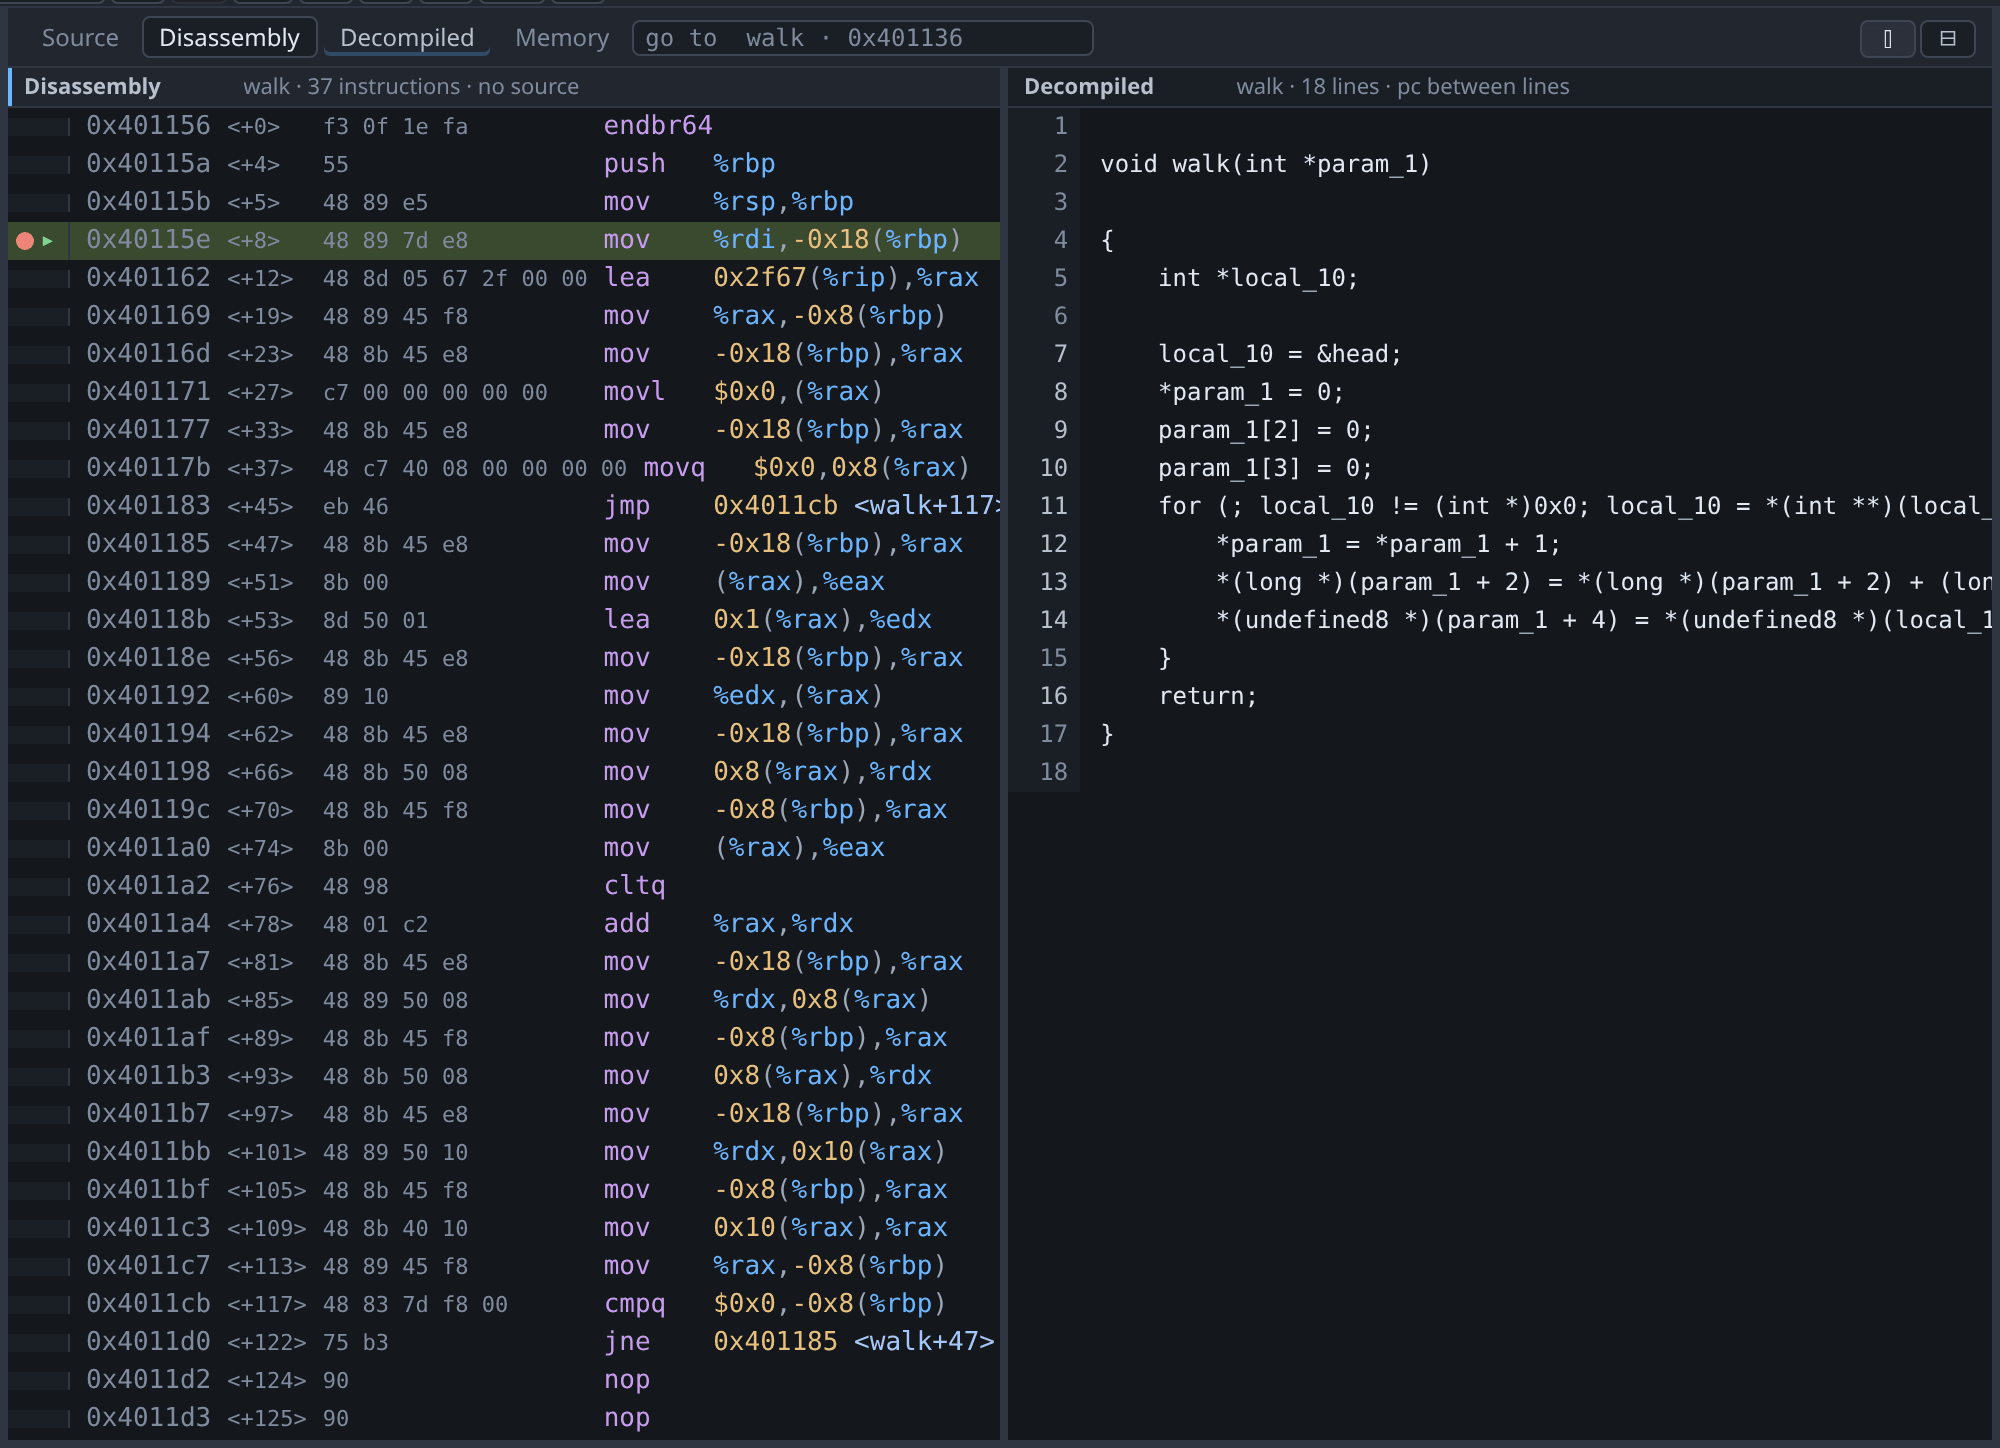
The second slot opens with the useful complement of what you were looking at: the decompiled C beside the disassembly, which is the pairing this exists for, and the disassembly beside anything else. Either slot can then be changed to any view from the tab strip.
Drag the divider to resize. The split button toggles it off again; the button beside it, or Shift+F7, stacks the two views instead of putting them side by side. Both the arrangement and the divider position are remembered.
One slot is focused, and the tabs and the keys act on it. Click in a view to focus it; the focused slot’s header is marked, and its view is the one the tab strip shows as active. This matters most for stepping: with the disassembly focused, F10 steps by instruction, and with the decompiled view focused it steps by decompiled line. Both views follow the program counter either way.
Jumping to a file, symbol or address
Type where you want to go into the box at the right of the tab strip, and the focused view goes there. Ctrl+Shift+G puts the cursor in it.
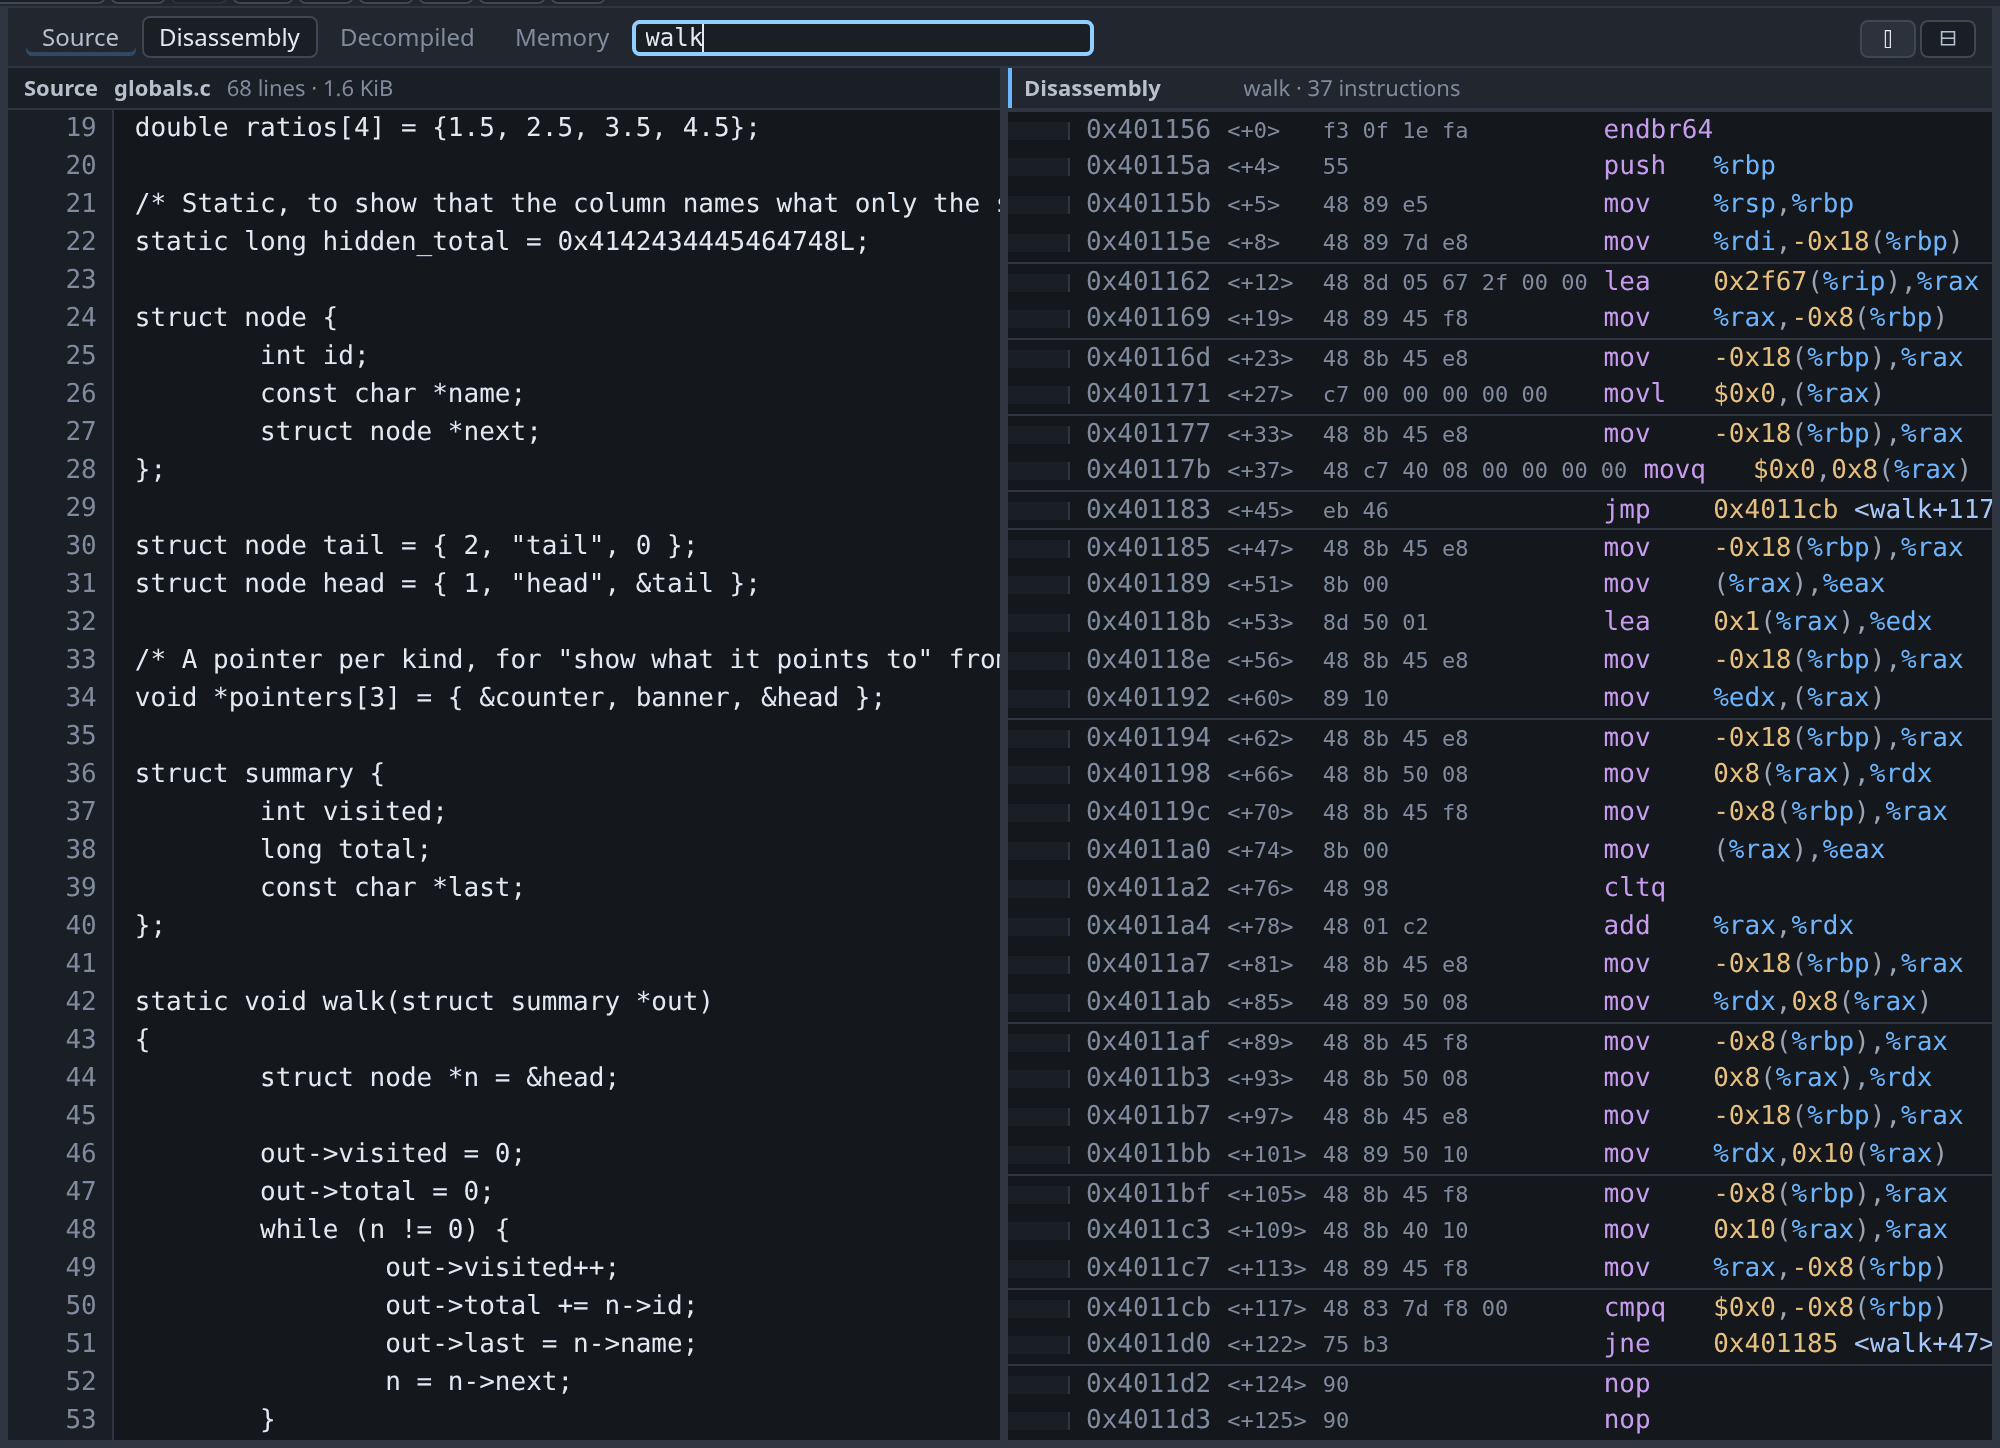
It takes any of these:
| What you type | Example |
|---|---|
| A symbol | walk, counter |
| An address | 0x401136 |
| Any gdb expression | &head, $pc, buf+16 |
| A file and a line | globals.c:65 |
| A line in the file already open | :65 |
| A decompiler name | FUN_0010e2dc, DAT_001a08de |
That last row is how you get anywhere in a stripped binary, where none of the others has anything to work with. The name comes from the decompiled text or from the symbol pane, and it is asked about only after gdb has refused, so a real symbol always wins. The address it resolves to is not the number in the name: those digits are where the function was linked, and a position-independent executable is somewhere else entirely once it is running.
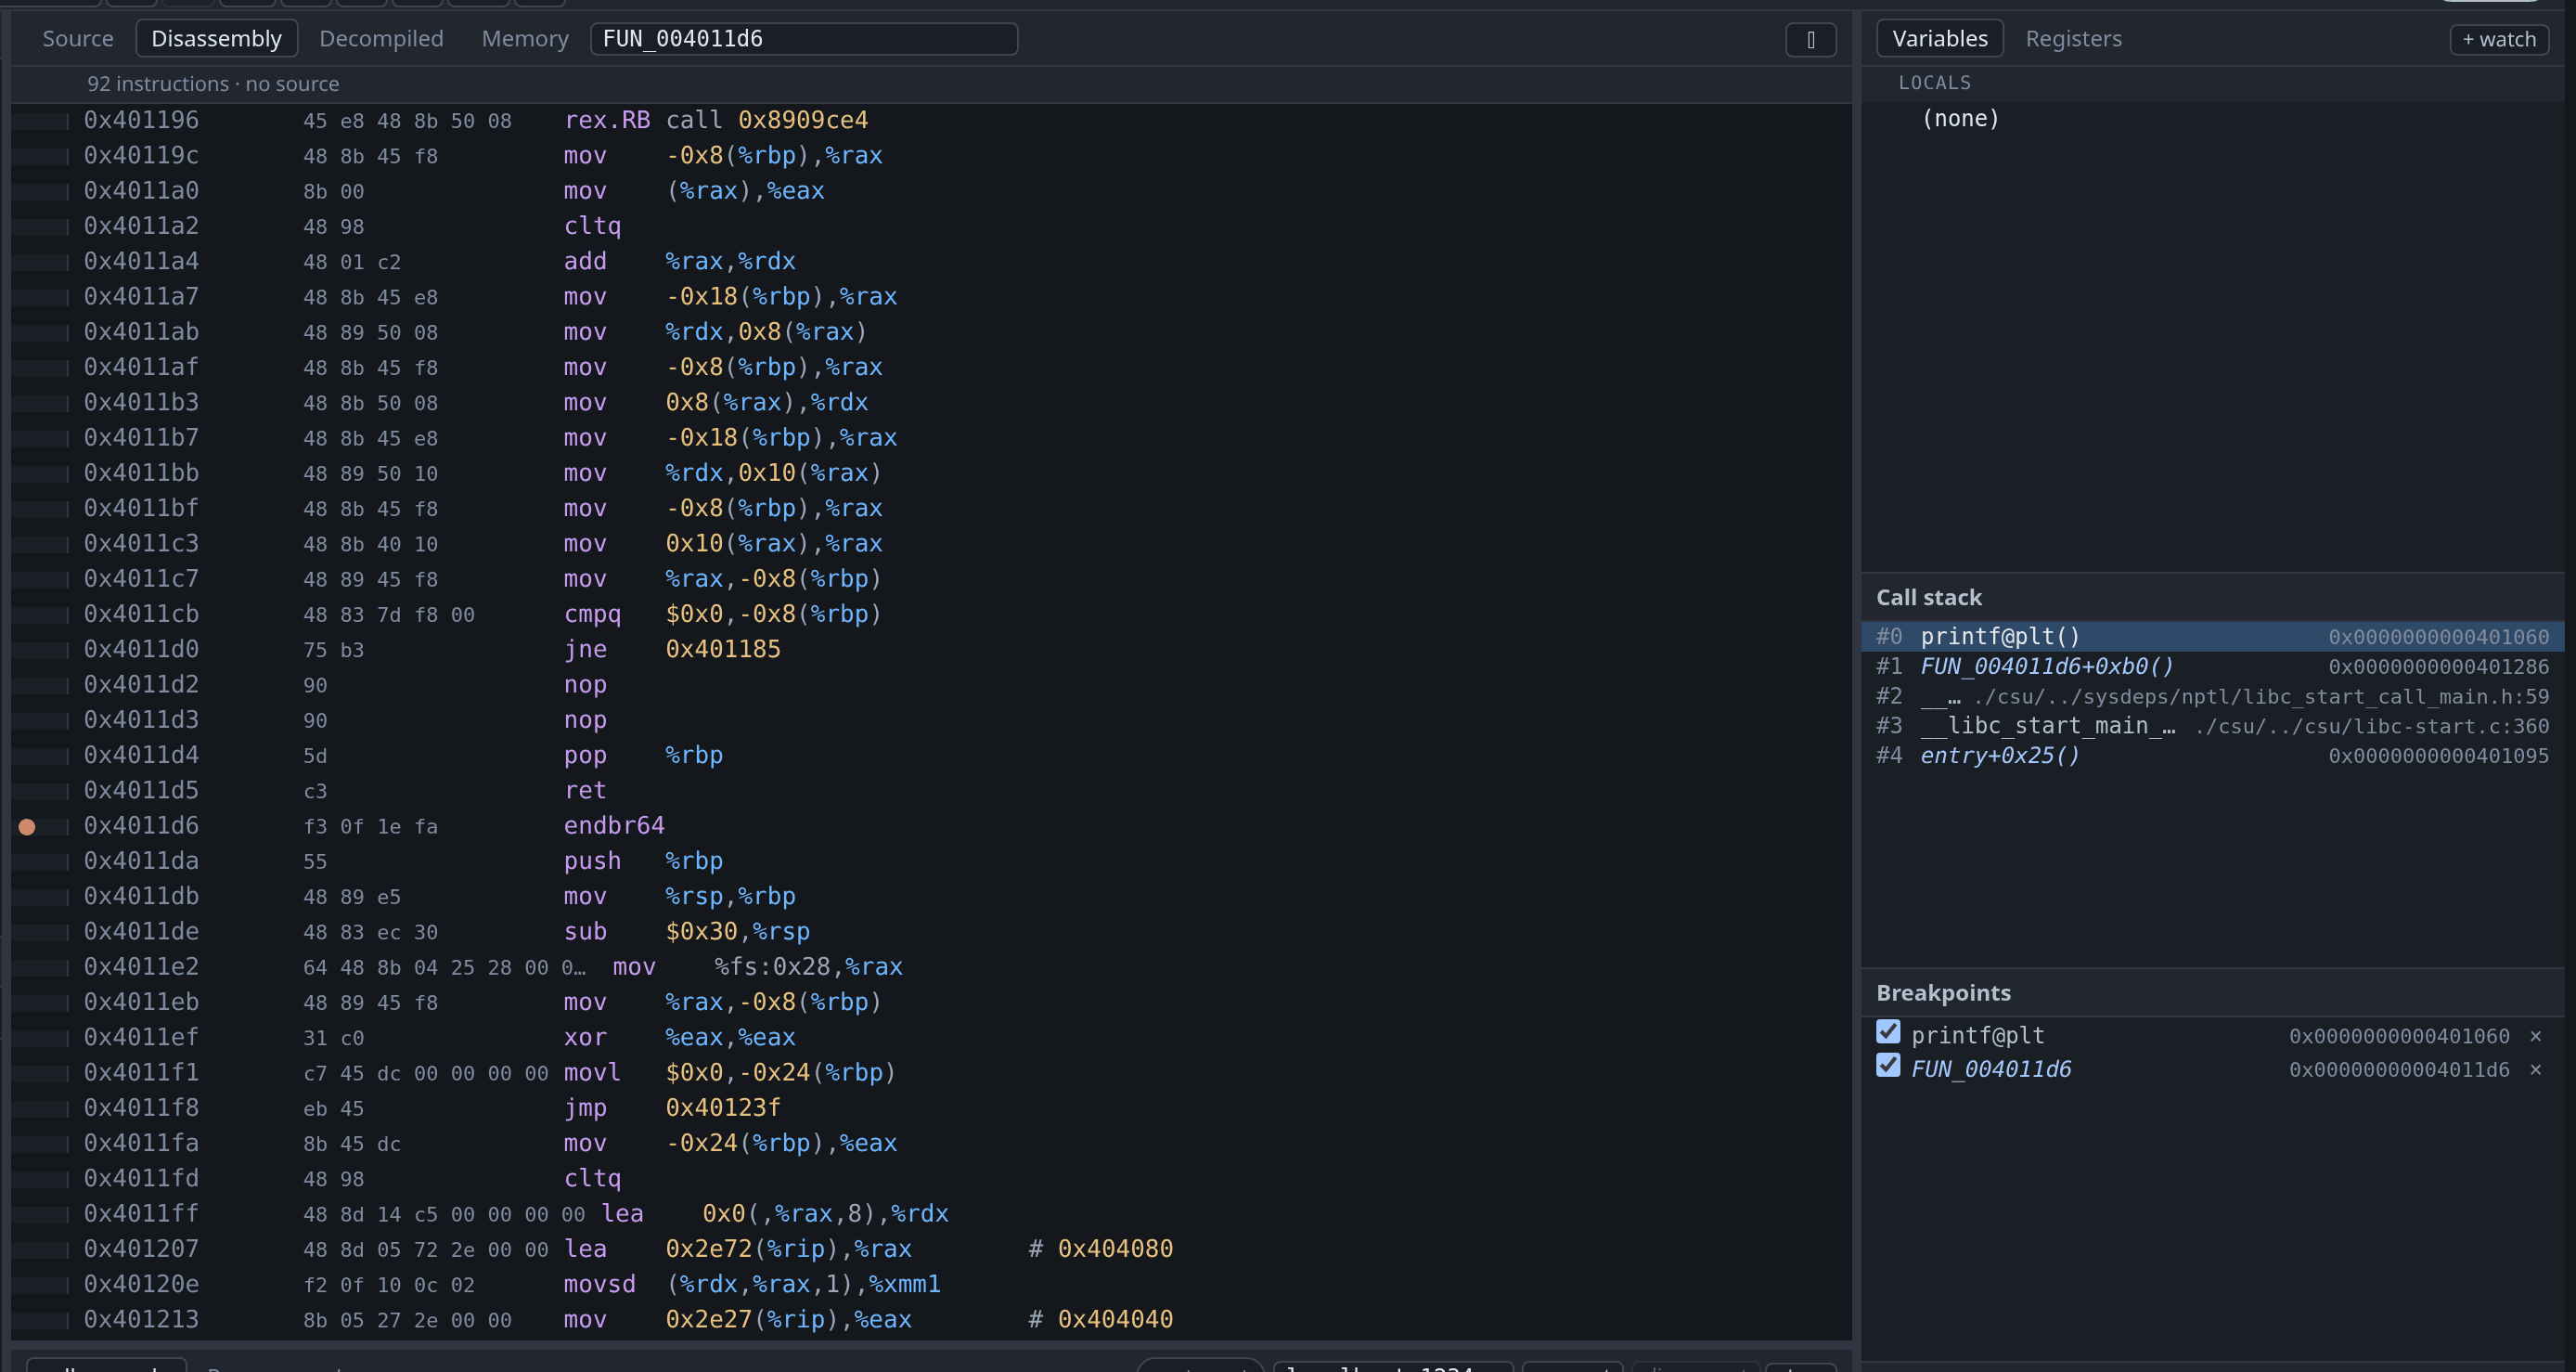
The same name works as a breakpoint location, which is the other half of being able to reach somewhere. Both rows in the Breakpoints pane above are resolved rather than pending.
It acts on the focused view, and only that one. In the screenshot the disassembly is focused, so walk sent it to that function and left the source pane beside it where it was. The same word typed with the source focused opens globals.c at line 42 instead.
That is one target resolved once, by gdb, and then handed to whichever view asked — which is what makes walk mean the same place in all four. gdb has to be the one to answer, because the symbol table records link-time addresses and every one of them is wrong once a position-independent executable is running.
A view that cannot show what you asked for says so and changes nothing rather than switching to a view that can. An address in a stripped binary has no source line; a variable has no instructions. What you typed stays in the box, so clicking another view and pressing Enter again is the whole fix.
When the source is not where gdb expects
A binary built on another machine records that machine’s source paths. When gdb names a file that is not present, gdb-wui shows a bar offering the files in your project whose names match. Choosing one tells gdb about the substitution for every file under that directory, not only the one you chose.
The offer follows the selected frame, because the file it is about does. A stack routinely mixes all three cases — a frame whose source is here, one whose file is on a machine you do not have, and one from a stripped binary with no file at all — and clicking between them changes which, if any, there is anything to offer.
Worked example
mkdir -p /tmp/tour && cp testdata/fixtures/globals.c /tmp/tour/
gcc -g -O0 -no-pie -o /tmp/tour/globals /tmp/tour/globals.c
./gdb-wui -project /tmp/tour
No -exe this time, so the first thing to do is what the tree is for: click globals, which has the ELF badge, and it becomes the program.
Open globals.c, click the gutter at line 49 — out->visited++; — and press Run. The green bar lands there, and the call stack has two frames.
Click #1 main(). The blue bar appears on line 64, the walk(&s); that got you here, and the green bar stays on 49: two frames, two markers, and the Variables pane now showing main’s locals rather than walk’s.
Now type walk into the go-to box with the source focused, and it opens at line 42 — the function’s own line, not the address the breakpoint sits at. Press F7, click the disassembly that opens beside it, and type walk again: the same word, resolved to the same place, shown as instructions in one pane and as source in the other.
What the source view does not do
- It does not edit. There is no save.
- It does not highlight syntax. Each rendered line is a single text node, which is what lets the hover evaluator map a pixel position to a character without a reverse mapping. Adding highlighting would mean rebuilding that.
- It does not serve files outside
-project, including through symlinks. - It refuses very large files rather than rendering them slowly.