Variables and hover
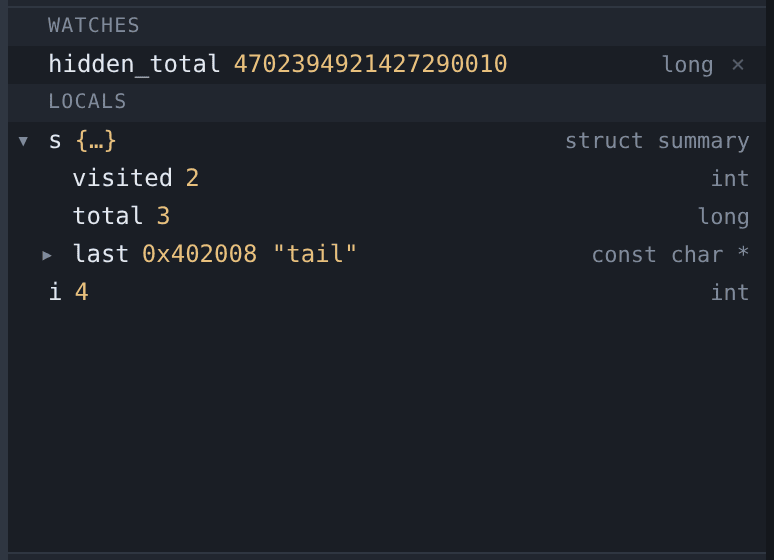
The Variables pane shows the locals and arguments of the selected frame, which can be expanded to any depth. To add an expression that is re-read at every stop and kept across stops, click + watch and type it into the box that opens over the pane’s header. An expression gdb will not evaluate leaves the box open with what you typed still in it.
Values that changed at the last stop are marked, so when stepping through a loop you can see which field moved without comparing against memory yourself.
To change a value, double-click it. See changing values.
Adding, removing and casting a watch
Add a watch with + watch in the pane header, and remove it with the × at the right of its row. A watch is the only thing in this pane you put there yourself, so it is the only one you can take away.
| To do this | Do this |
|---|---|
| Add a watch | + watch in the pane header |
| Remove one | The × on its row, or right-click → Remove watch |
| Read it as another type | Double-click its type, or right-click → Cast to… |
Casting is what makes a watch on a stripped binary useful. A global picked up from the decompiled view arrives as something like *(undefined8 *)0x555555619250 — which is what is at that address, not what it means. Type char ** over the type cell and the row becomes (char **)(*(undefined8 *)0x555555619250), reading the same bytes as what they actually are.
The expression is wrapped rather than replaced, so the address you found stays exactly as you found it, and the cast stays visible in the row afterwards. The watch also keeps its place in the list and anything you had expanded under it — a watch you are correcting is the same watch. If gdb refuses the type, nothing changes: the watch you had goes on working.
Watching something from the decompiled view
Right-click a name in the Decompiled tab and choose Watch. This is the main way to keep an eye on a value in a binary with no debug info, where there are no locals for the pane to list.
A global is the one to reach for. It lives at a fixed address, which is valid at every program counter and needs no frame, so a watch on one keeps reading correctly however far you step. A stack slot works too and floats with the current frame. A register-backed variable is offered with a warning in the tooltip, because the decompiler’s expression for one is only valid near the program counter it was recovered at — the register gets reused.
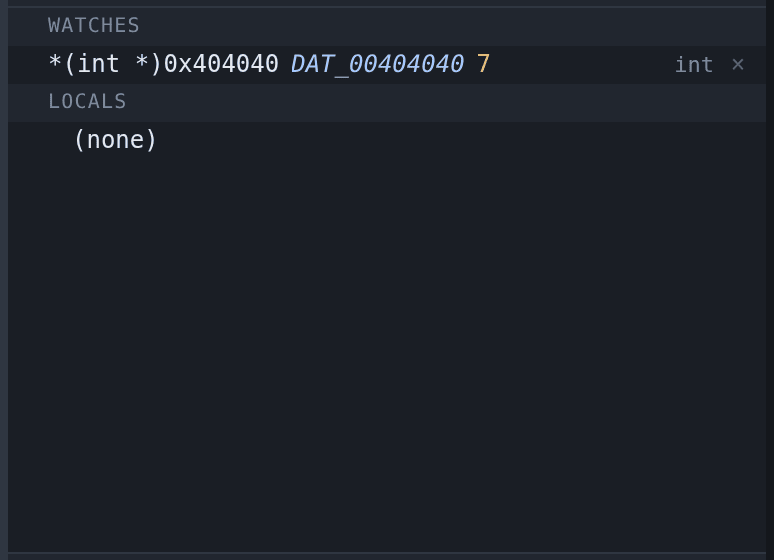
The name comes with it. A watch made this way reads *(int *)0x404040, which says where to look and nothing about what is there, so the decompiler’s name for that address is shown beside it — DAT_00404040, or whatever you have renamed it to in Ghidra. It is in the same italics the call stack uses, for the same reason: Ghidra’s label is not a symbol the binary carries.
Beside the expression rather than instead of it. The expression is what is being read, and it is what a cast or a removal acts on; a row showing only the name would leave you unable to tell which of two labels at neighbouring addresses the watch is actually on. Anything you type yourself is labelled the same way, as long as it names one address outright — *(int *)0x404040 does, head->next does not, because that address is computed rather than stated.
Reading a value by hovering
To read a value, rest the pointer on it for 300 ms.

gdb-wui reads the whole expression, not the word under the pointer: hovering name in cfg.items[2].name gives you that field rather than something else called name. The evaluator walks ., -> and […] outwards from the character you are on.
In the disassembly, hovering reads registers instead — %rax on x86, or a bare r0 or sp on other architectures — and the symbol in an annotation such as <add+4>.

Integers are also shown in the other base, so that a value like 140737488347136 is shown as 0x7fffffffe000 as well.
Values are read from the frame selected in the call stack. The tooltip closes as soon as the program moves, so it cannot show a value from the previous stop.
Only names, fields and subscripts are evaluated;
f(x)is not. gdb would answerf(x)by callingfin the program being debugged, with whatever side effects that has, so the expression parser stops at a(.
Showing where a value lives
To see the memory behind a value, right-click it.
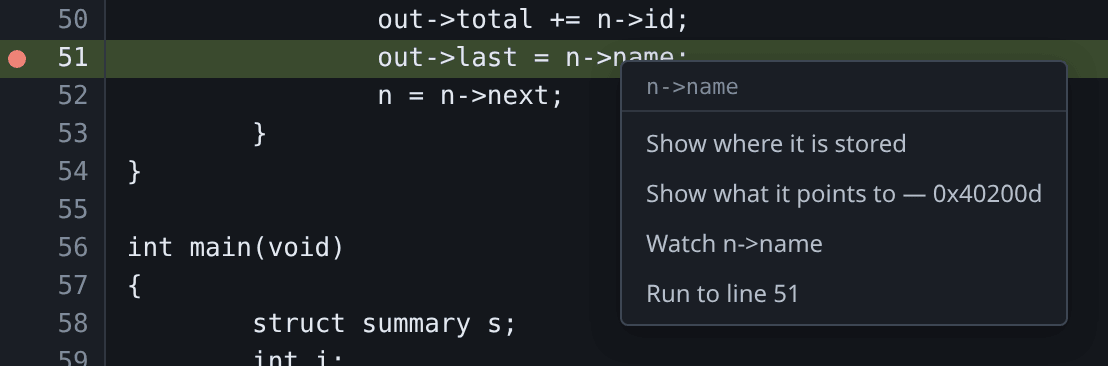
The menu names the address each entry would show:
- Show where it is stored — the address of the variable itself.
- Show what it points to — the address the variable holds.
- Watch it — add the expression to the Variables pane, where it is re-read at every stop. See watching from the decompiled view.
- Run to this line — the line the pointer is on, rather than the value on it. See running to a line.
A pointer has both addresses, and they are different. A plain int has only the first. A variable held in a register has only the second, and the first entry is omitted rather than shown with a wrong address.
This also works for registers, which is what makes them useful here: %rbp, or a char * in $x0, leads directly to the bytes. Values below the first page are not offered as pointers, because that page is never mapped.
Worked example
mkdir -p /tmp/tour && cp testdata/fixtures/globals.c /tmp/tour/
gcc -g -O0 -no-pie -o /tmp/tour/globals /tmp/tour/globals.c
./gdb-wui -project /tmp/tour -exe globals
Break on line 65 and run. Expand s in the Variables pane to see visited 2, total 3 and last 0x402008 "tail". Add a watch on hidden_total, then step: it is a global, so it stays readable in every frame.
Now hover s.last on line 66 to see the string, right-click it, and choose Show what it points to to open the memory viewer on the characters themselves.
What variables and hover do not do
- They do not call functions, as above.
- They do not recover optimised-out values. At
-O2a local may not exist anywhere; the pane and the tooltip both show<optimized out>rather than a plausible wrong value. - They add no pretty-printers. Values are formatted by gdb, so any gdb Python pretty-printers you have configured do apply.