Threads and the call stack
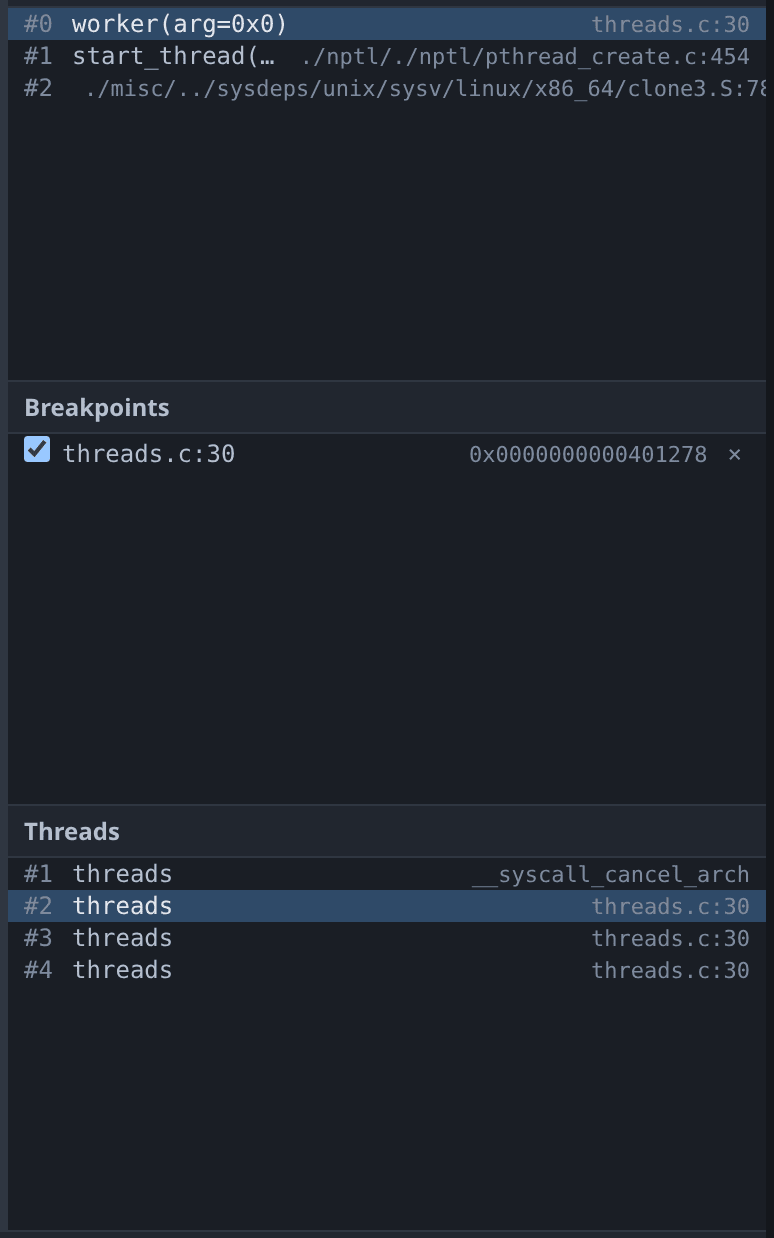
The Threads pane lists every thread gdb knows about and the frame each one is in. Clicking a thread switches to it, and the call stack, Variables, Registers and source markers all follow. The reply to a thread switch carries that thread’s stack, so no pane is left showing the previous thread’s frames.
Clicking a frame selects it without moving the program counter. See source for what the two markers mean; everything you read afterwards comes from the frame you selected.
All-stop only
When one thread stops, all of them stop, and when you continue, all of them continue. This is gdb’s all-stop mode, and it is the only mode gdb-wui supports. Non-stop mode, where some threads run while others are stopped, is a gdb feature that this UI does not model.
Worked example
mkdir -p /tmp/tour && cp testdata/fixtures/threads.c /tmp/tour/
gcc -g -O0 -no-pie -pthread -o /tmp/tour/threads /tmp/tour/threads.c
./gdb-wui -project /tmp/tour -exe threads
Set a breakpoint on line 30, inside the worker loop, and press Run. The main thread and three workers appear. Click between them: thread #1 is in the barrier or in pthread_join, the workers are in worker, and each shows its own stack.
Press ⏸ instead of setting a breakpoint to interrupt the threads wherever they happen to be, which for this program is usually inside libc’s nanosleep. The frame is still real, and the call stack shows how it was reached.
What threads and the call stack do not do
- Non-stop mode is not supported, as above.
- Per-thread breakpoints have no UI. Use
break … thread Nat the console. - Naming and filtering threads is not supported. The list shows everything gdb reports.
- Frame filters and Python frame decorators are not supported.