Remote targets
gdb-wui can debug anything that speaks the GDB remote protocol: a gdbserver, an emulator’s stub, or a board on the end of a probe. A kernel is one of these, with enough of its own to say that it has its own page. It can also attach to a process already running on this machine: a target it did not start and must not kill.
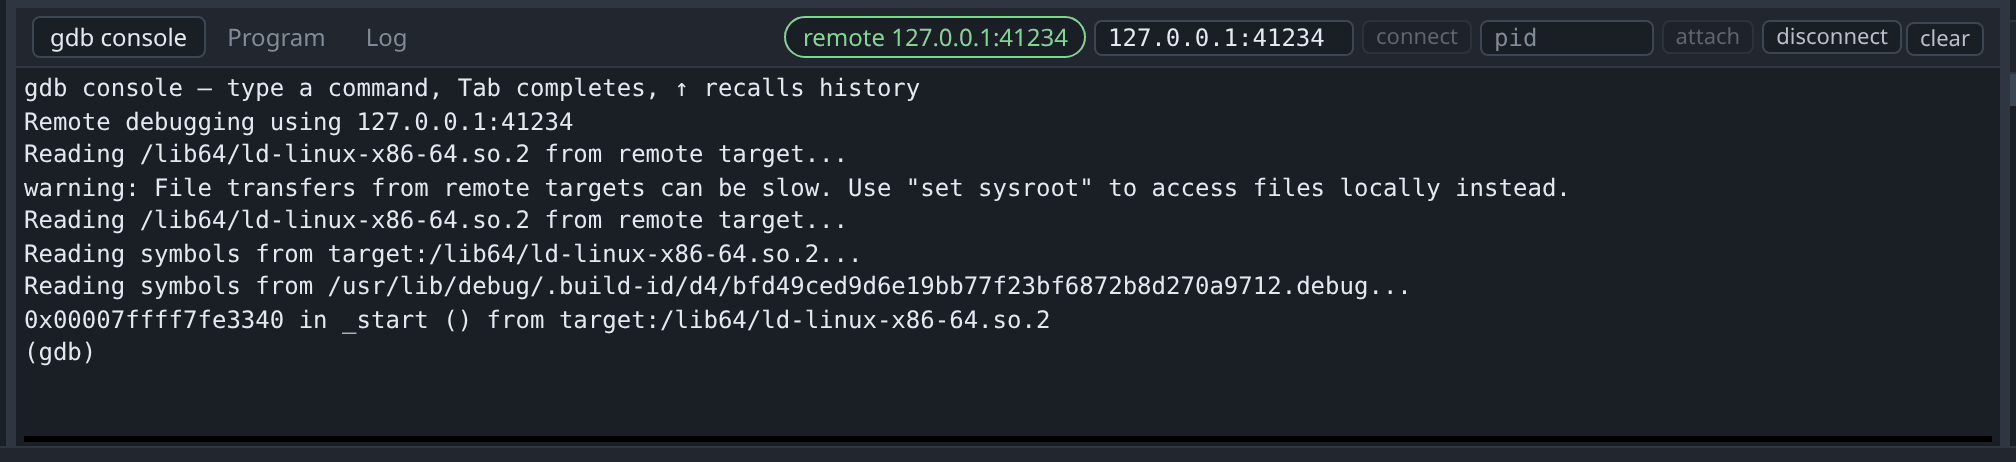
The address box and the connect and disconnect buttons are in the console’s tab bar, with a pill showing whether gdb is attached, and a pid box for attaching to a local process beside them. The buttons run target remote <address> and disconnect, so the console below shows what ran, and shows gdb’s own error text if the stub refuses.
Disconnecting uses disconnect rather than detach, because detach resumes the target and someone inspecting a stopped machine usually does not want that.
Load the program before connecting
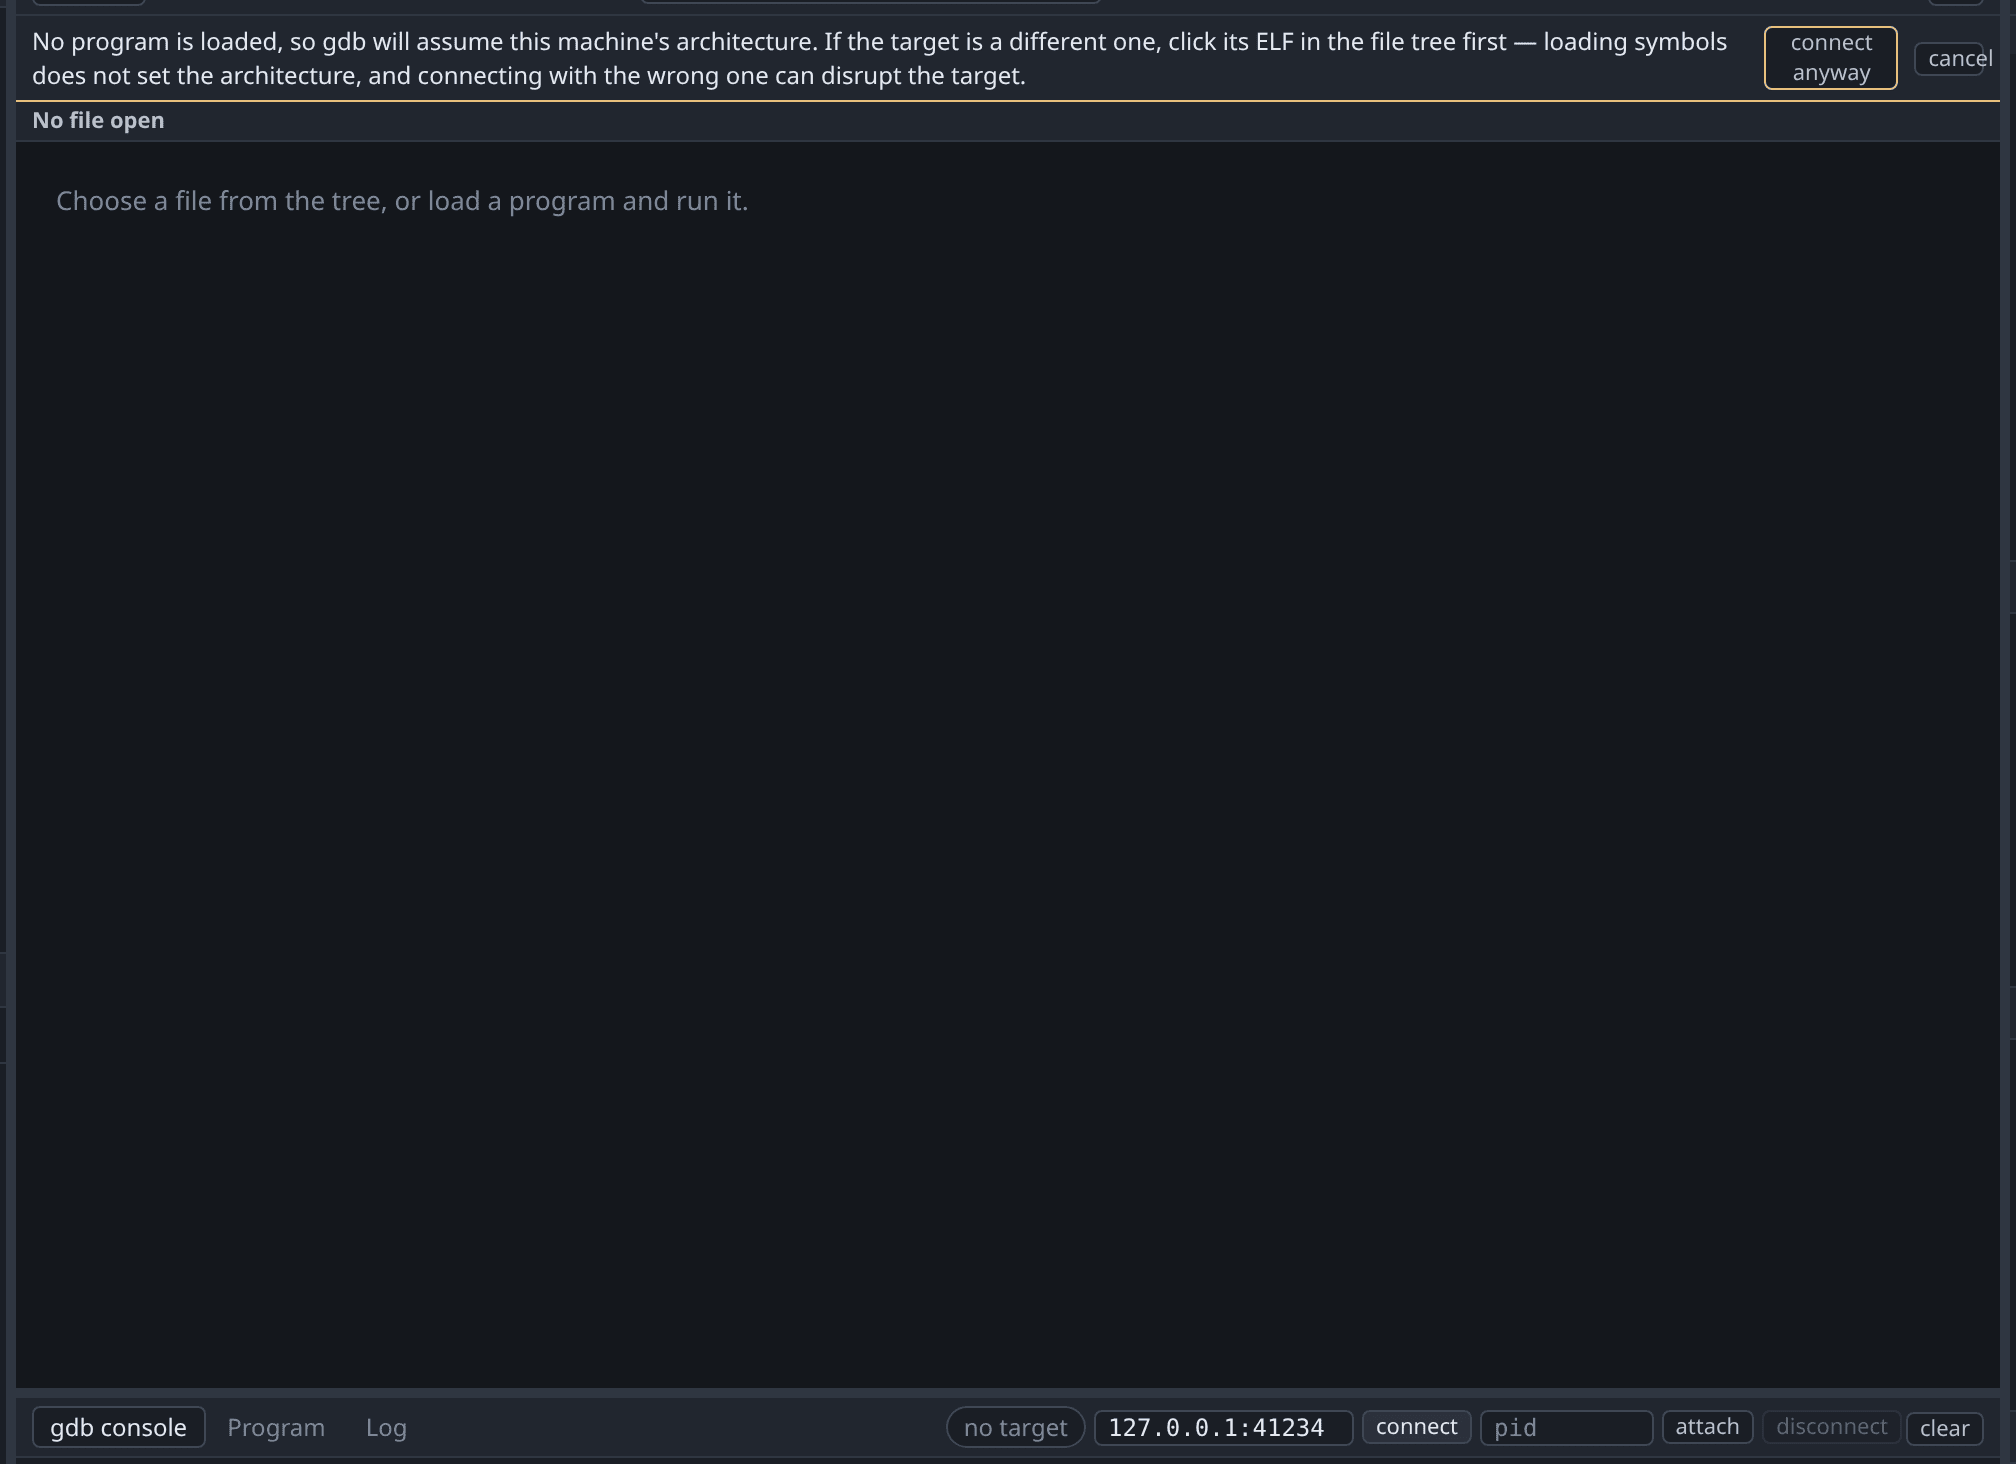
Load the program first, then connect. gdb-wui asks for confirmation if you try it the other way round.
target remote asks the stub for its registers immediately, and reading that reply requires knowing the architecture. If gdb has the wrong architecture it misparses the reply — a MIPS64 target read as x86-64 reports a meaningless program counter, and can disturb the target enough to end the session.
Only loading the program sets the architecture, because only file reads it from the ELF header. Measured against gdb 17.1 with a MIPS64 image: file gives mips:octeon/big, while symbol-file and add-symbol-file both leave gdb at the host’s i386. Loading symbols is therefore not enough, even though the Symbols pane fills with correct names.
Debugging another architecture
To debug binaries for another architecture, install a suitable gdb (e.g. gdb-multiarch) on your host machine, and use the -gdb argument when starting gdb-wui to use it:
sudo apt install gdb-multiarch
./gdb-wui -project . -gdb gdb-multiarch -exe firmware
Connecting at startup
Pass the commands with -gdb-command, once per command, and they run in the order given as soon as gdb is up:
./gdb-wui -project . -gdb gdb-multiarch \
    -gdb-command 'set architecture arm' \
    -gdb-command 'target remote 127.0.0.1:9999'
This is gdb’s -ex by another name, and it is how a session that always starts the same way stops needing to be typed. It runs after -exe, matching gdb prog -ex ...: loading the program is what sets the architecture, and a command that assumes it has to come second.
set architecture is worth having in the list for a target with no program to load — an emulator running a raw kernel image — because there is then no ELF to set it from. Some stubs say what they are and gdb picks it up on its own; several do not, and connecting with the wrong architecture is the failure the section above describes.
The commands are ordinary console commands, so their output lands in the Console tab. The terminal gets a line per command and a line saying where the sequence arrived:
gdb-wui: gdb command: set architecture arm
gdb-wui: gdb command: target remote 127.0.0.1:9999
gdb-wui: after 2 gdb command(s): stopped, connected to 127.0.0.1:9999
They can also live in a config file as a list, which is the shape that suits a target you return to:
{
  "gdb": "gdb-multiarch",
  "gdb-command": [
    "set architecture arm",
    "target remote 127.0.0.1:9999"
  ]
}
Attaching to a local process
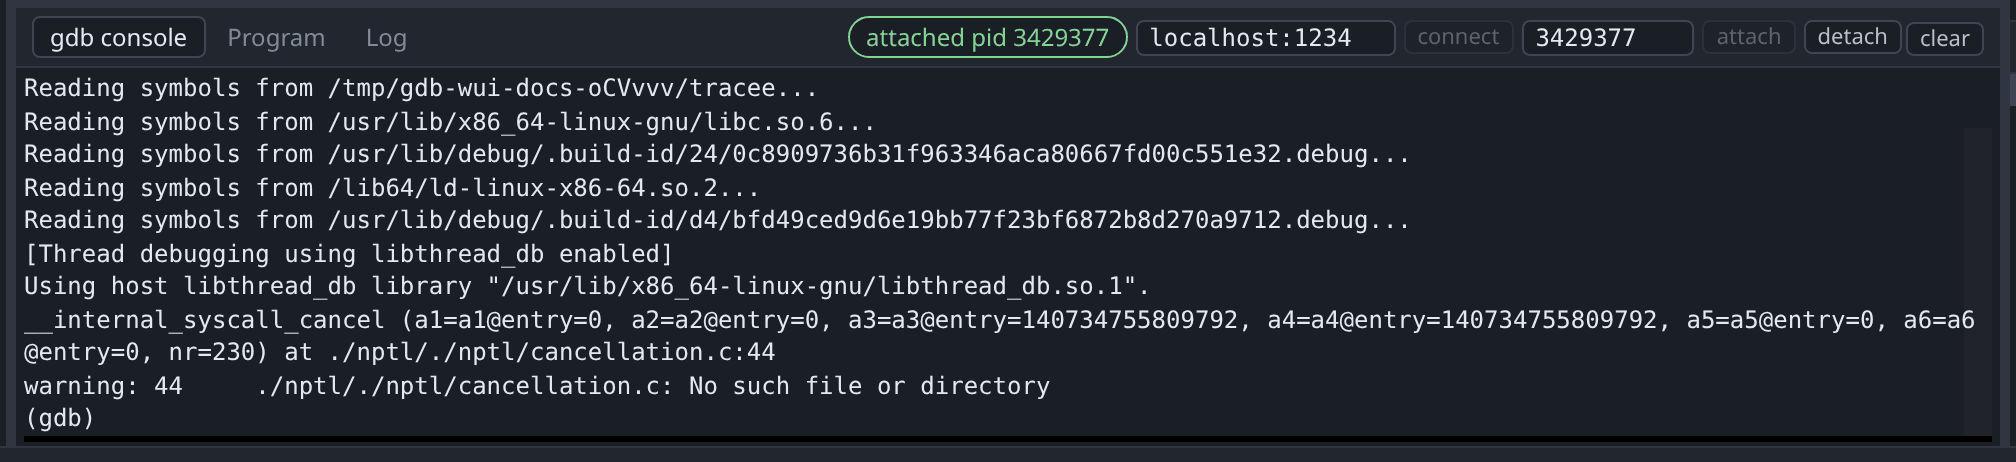
Put the pid in the narrow box beside the address one, and press attach or Enter. It runs attach <pid>, so the console below shows the command and gdb’s answer to it, and typing that yourself does the same thing.
There is nothing to load first: gdb reads the program out of /proc/<pid>/exe, symbols and architecture together, so the ordering care above applies to stubs and not to this. The pill reads attached pid 1234 and the button at the end of the bar becomes detach.
Detaching leaves the process running, and so does shutting gdb-wui down — a program that was somebody else’s before the session stays theirs afterwards. The kill button asks first, because killing one ends a program this session did not start.
Two things an attached process does not bring with it:
- No terminal. It keeps the one it already had, so its output goes there and the terminal pane stays empty.
- No file of its own, so the decompiler asks gdb which program it has and reads that file. Clicking its ELF in the file tree works too. See a program gdb-wui did not load.
On Linux, attach usually needs permission. The default kernel.yama.ptrace_scope of 1 allows tracing only a descendant, so attaching to an unrelated pid needs sudo sysctl kernel.yama.ptrace_scope=0, or a process that has called prctl(PR_SET_PTRACER, …) for itself. Without it gdb answers ptrace: Operation not permitted. in the console and nothing is attached.
Try it
tracee.c is here to be attached to: it asks for any tracer with prctl(PR_SET_PTRACER, …), so this works without touching the sysctl above.
mkdir -p /tmp/tour && cp testdata/fixtures/tracee.c /tmp/tour/
gcc -g -O0 -no-pie -o /tmp/tour/tracee /tmp/tour/tracee.c
/tmp/tour/tracee & echo "pid $!"
./gdb-wui -project /tmp/tour
It prints ready once it can be attached to, and exits by itself after a minute — start it again if you take longer.
Put the pid the shell printed into the box, press attach, and the pill turns green. The program is stopped in whatever it was doing, which is sleep, so the call stack shows libc’s nanosleep frames under main. Press continue, then pause, and it stops somewhere else in the same loop.
counter is a global it increments every second, so the Variables pane has something to watch: add counter, continue, pause again, and it has moved. The Decompiled view works too: attaching loads no file of its own, so the decompiler reads the one gdb found for the process.
Press detach when you are done, and the process carries on without you.
Worked example
A local gdbserver behaves the same way as anything remote, so it is a convenient thing to try first:
mkdir -p /tmp/tour && cp testdata/fixtures/globals.c /tmp/tour/
gcc -g -O0 -no-pie -o /tmp/tour/globals /tmp/tour/globals.c
gdbserver 127.0.0.1:41234 /tmp/tour/globals &
./gdb-wui -project /tmp/tour
Click globals in the file tree to load it, enter 127.0.0.1:41234 in the address box, and press connect. The pill changes to remote 127.0.0.1:41234, and the console shows gdb’s account of the attach.
To see the guard, try it in the wrong order: connect before loading anything and gdb-wui shows the warning above instead of connecting with the wrong architecture.
For qemu in user mode the shape is the same, and it is worth doing once on a program you can rebuild, because it is where the architecture rule above stops being theoretical:
sudo apt install gcc-arm-linux-gnueabihf qemu-user gdb-multiarch
mkdir -p /tmp/tour && cp testdata/fixtures/hello.c /tmp/tour/
arm-linux-gnueabihf-gcc -g -O0 -static -o /tmp/tour/hello-arm /tmp/tour/hello.c
qemu-arm -g 1234 /tmp/tour/hello-arm &
./gdb-wui -project /tmp/tour -gdb gdb-multiarch -exe hello-arm
Statically linked so that qemu needs no sysroot; -L /path/to/sysroot is the alternative if you would rather link against the target’s libraries. qemu waits for a debugger before running anything, so nothing is missed by connecting late.
Connect to localhost:1234 and the program stops at _start. Type show architecture at the console and gdb answers The target architecture is set to "auto" (currently "armv7") — read out of the ELF you loaded, not out of qemu. Load nothing first and gdb reads the stub’s registers as x86-64 instead, which is the failure the warning above exists to prevent. The Registers pane is another way to see it: r0 and cpsr rather than rax and eflags.
Other architectures are the same recipe with the names changed. AArch64 wants gcc-aarch64-linux-gnu, aarch64-linux-gnu-gcc and qemu-aarch64, and answers aarch64 with x0 and sp in the Registers pane; PowerPC wants gcc-powerpc-linux-gnu or gcc-powerpc64-linux-gnu and qemu-ppc or qemu-ppc64, and answers powerpc:common or powerpc:common64 with r0 and lr; MIPS wants gcc-mips-linux-gnu or gcc-mips64-linux-gnuabi64 and qemu-mips or qemu-mips64, and answers mips:isa32r2 or mips:isa64r2 with zero and ra. Seven of them are tested against a live qemu on every push, counting both endiannesses of 64-bit PowerPC.
On 64-bit PowerPC’s ELFv1 the call stack reads
._startand.main, with a leading dot. Those are the real function symbols: the undotted name is a descriptor — a triple of addresses — and the dotted one is the code.
Source debugging works from here like any other target: open hello.c in the file tree, click line 14, and the breakpoint resolves to main. That is what the cp in the first block is for — a binary records the path its compiler was given, so one built straight out of testdata/fixtures leaves gdb with a file name that is nowhere under -project. See No source file named ….
What remote targets do not do
- gdb-wui does not launch anything. It does not start gdbserver, run qemu or flash a board. Start the far end yourself, then connect to it.
- It does not detect the target’s architecture. The architecture comes from the ELF you load, which is why the order matters.
- It does not open core dumps.
- It does not list processes to pick from. The attach box takes a pid you already have, from
pgrep,psor whatever started the thing. extended-remote,target simand similar are not on the buttons. Type them at the console; the pill follows, because it reflects gdb’s state rather than which button was pressed.
If the far end is qiling, a successful single-step is reported as
SIGTERMon AArch64 and x86. This is a bug in qiling’s stub rather than a problem with your program; see Troubleshooting.