Disassembly
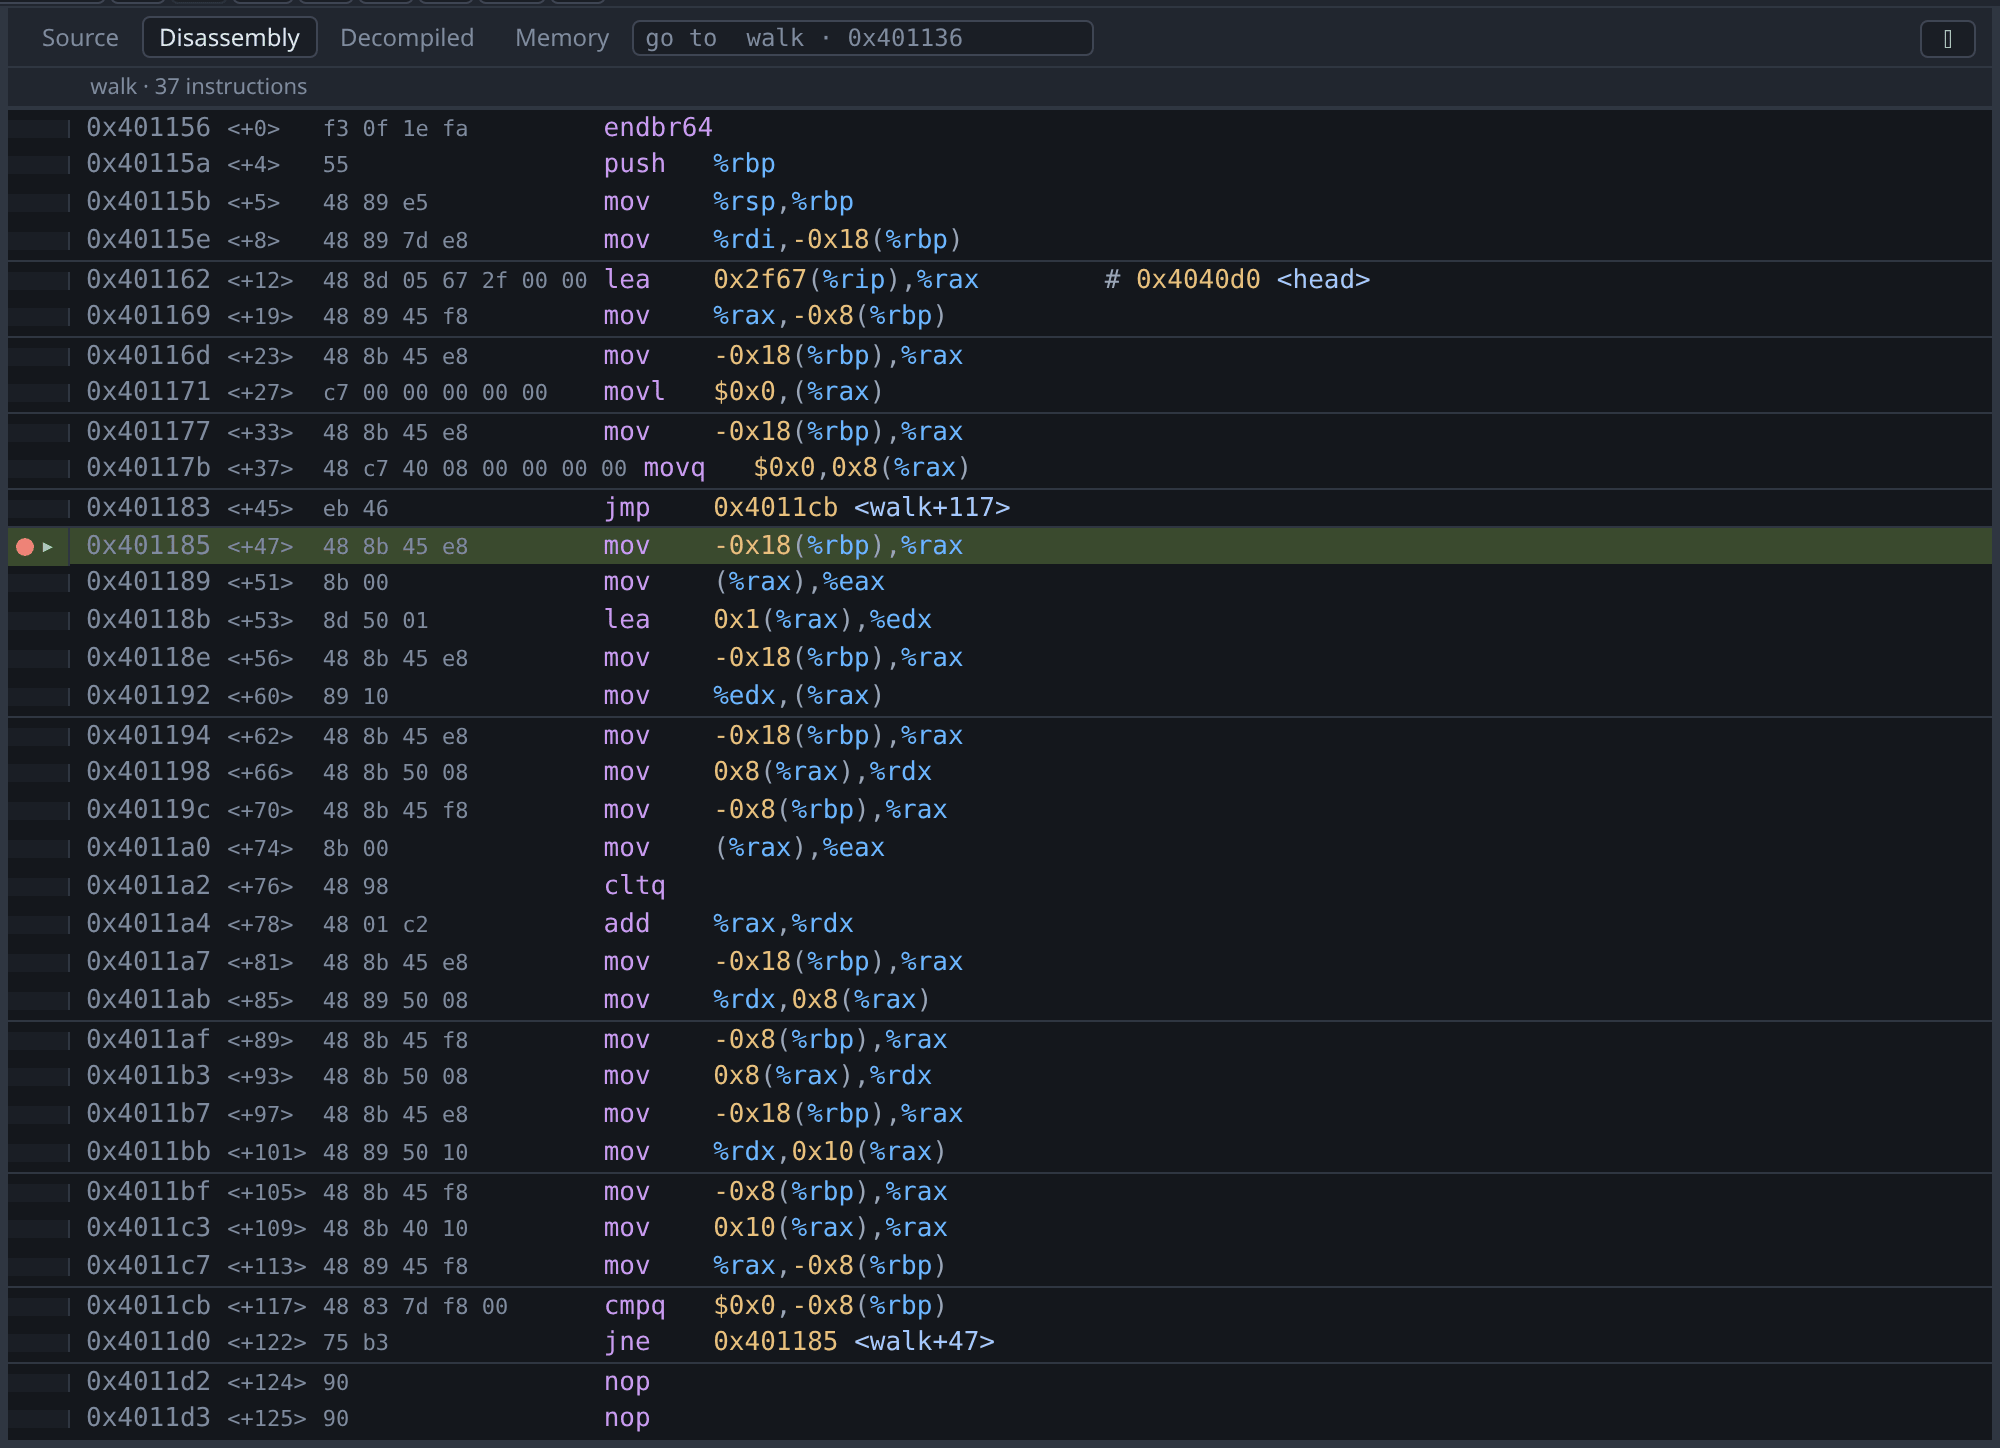
The Disassembly tab shows the function containing the program counter, and follows it as you step. Each row has the address, the offset from the start of the function, the opcode bytes, and the instruction. Registers, immediates and symbols are coloured differently so that operands are easier to scan.
The ▸ in the gutter marks the program counter, and the dot beside it marks a breakpoint. Clicking the gutter sets a breakpoint on an address, which is not the same as setting one on a line; see breakpoints.
Faint rules separate the instructions belonging to each source line, when there is a line table to say where the boundaries are. Without one the listing is continuous.
gdb annotates operands where it can: the # 0x4040d0 <head> on the lea in the screenshot is gdb resolving a rip-relative operand to a symbol. Hovering a register reads it, and hovering an annotation reads the symbol; see hover.
To read the instructions and the recovered C together, rather than switching between them, split the centre view.
Pinning the view to a function
The view normally follows the program counter. To look at a different function, type its name into the go-to box at the right of the tab strip — see jumping to a file, symbol or address — or double-click a symbol in the Symbols pane. Either pins the view there, so that switching to this tab does not jump back to the program counter. The pin is dropped at the next stop, because the program counter has then moved and following it is useful again.
Worked example
Build a binary with nothing to go on:
mkdir -p /tmp/tour && cp testdata/fixtures/nodebug.c /tmp/tour/
gcc -O0 -no-pie -o /tmp/tour/nodebug /tmp/tour/nodebug.c && strip /tmp/tour/nodebug
./gdb-wui -project /tmp/tour -exe nodebug
There is no source and none of the program’s own symbols. strip removes .symtab but leaves the dynamic symbol table, so the Symbols pane still lists the library stubs — printf@plt and a few others — and nothing that was written in this program. There is no main to break on.
Press Run→entry, because the entry point is the one address you know exists. The disassembly is then the only view with anything in it, and Alt+F11 steps one instruction at a time.
If you want more than this, see decompilation.
What the disassembly does not do
- It does not edit or patch. There is no assembler and no way to write bytes.
- It does not draw a control-flow graph. The listing is linear.
- It does not show cross-references. It cannot answer “what calls this”.
- It does not switch to Intel syntax by itself. Run
set disassembly-flavor intelat the console, and this pane will use it.