Running and stepping
Starting a program
| Button | Key | What it does |
|---|---|---|
| Run | Ctrl+F5 | Runs to the first breakpoint. With no breakpoints set, the program runs to completion. |
| Run→main | Ctrl+Shift+F5 | Runs and stops at main, whether or not a breakpoint is set there. |
| Run→entry | Stops at the first instruction, before the C runtime has started. |
Use Run→entry for a stripped binary. There is no main to break on, and often no symbol at all, so the entry point is the only address you know exists. Once stopped there, the disassembly and Symbols pane have something to show.
Moving through a program
| Button | Key | gdb command |
|---|---|---|
| ▶ | F5 | continue |
| ⏸ | F6 | interrupt |
| ⤼ | F10 | next — step over a call |
| ↳ | F11 | step — step into a call |
| ↰ | Shift+F11 | finish — run to the end of this frame |
| ↓i | Alt+F11 | stepi — one instruction |
| ⤼i | Alt+F10 | nexti — one instruction, over a call |
| ■ | kill |
Buttons disable themselves when gdb would refuse the command: nothing is steppable while the program runs, and nothing is continuable before it starts. If a button is grey, typing the equivalent command at the console would produce an error.
Running to a line
Right-click a line and choose Run to it. The program runs until it gets there, and stops.

It works in all three code views. In the source and the decompiled C the entry names the line; in the disassembly it names the address, since that is what a row there is. A decompiled line generated from no address — a brace, a declaration — is nowhere to run to, and the menu offers nothing for it, the same lines the gutter refuses a breakpoint on.
With the program not yet started, this starts it. That makes it a way to begin a session at the line you care about rather than at main.
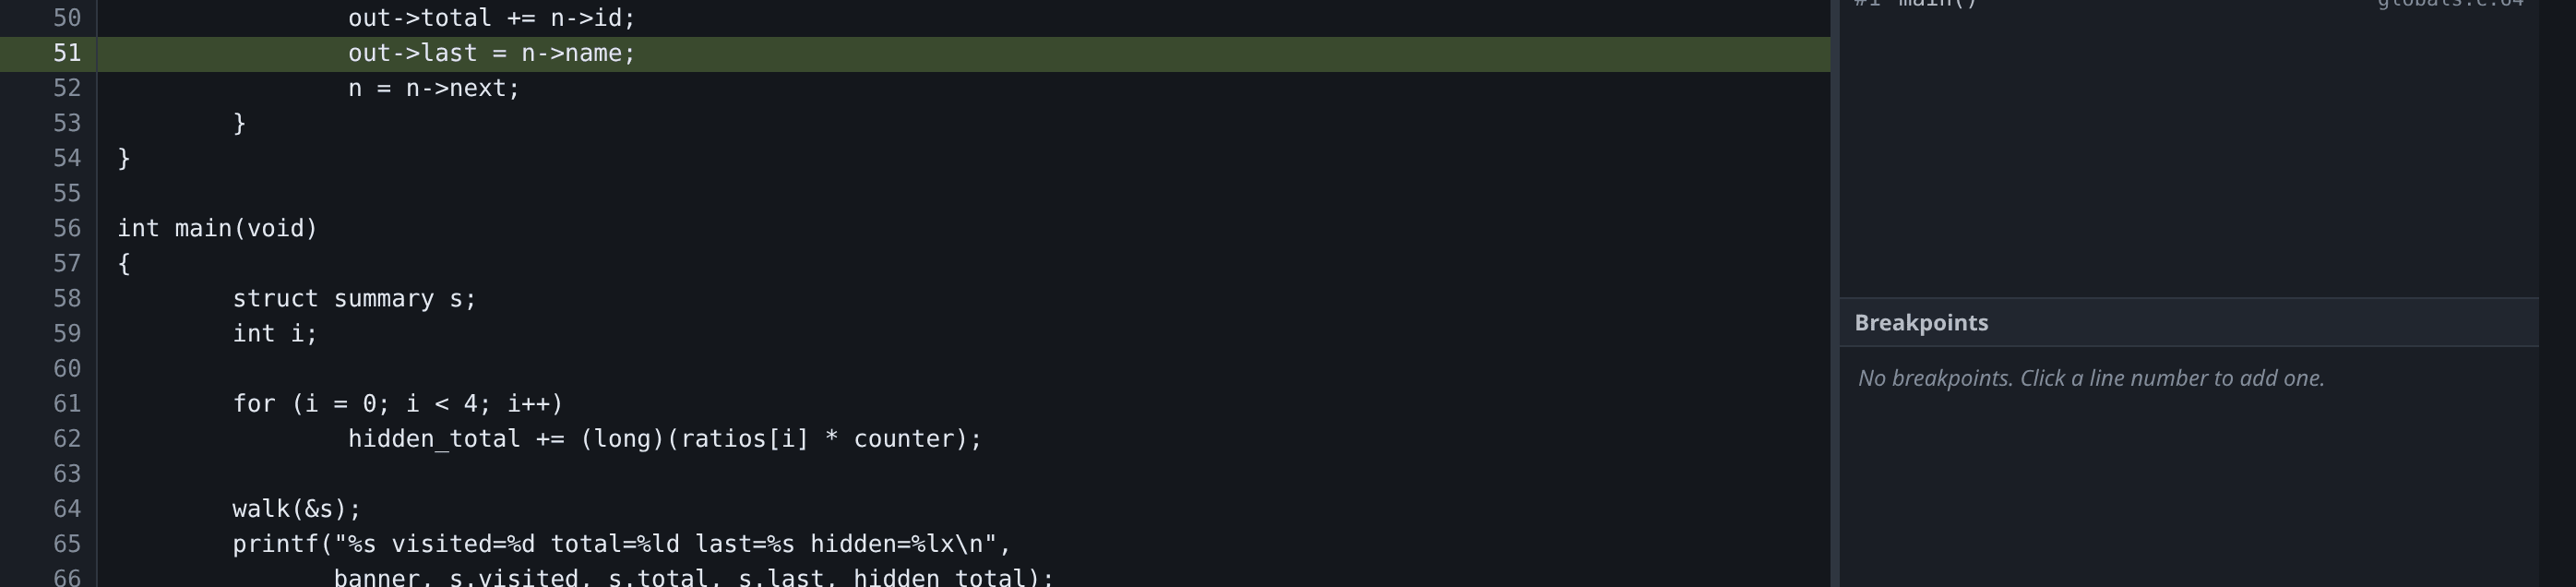
Underneath it is a temporary breakpoint and a resume, sent as one request. gdb’s own until and advance are not the same thing: both also stop when the current frame returns, so running to a line in a function that has not been called yet would stop somewhere else and report a stop. A breakpoint is reached wherever it is, in whatever frame.
The breakpoint appears in the Breakpoints pane while it lasts, and gdb deletes it when it is hit — the screenshot above is the pane after arriving, with nothing in it. A run that never reaches the line leaves it there, visible and deletable, rather than arming something invisible for the next run.
Stepping without a line table
To step in a binary with no debug info, open the Decompiled tab and step as usual, or press Alt+F11 to step one instruction at a time.
F10 and F11 need debug info: without it gdb’s step range is the whole function, so stepping over runs to the end of it. While the Decompiled tab is showing, a step moves to the next decompiled line instead, using Ghidra’s address map in place of the missing line table.
Worked example
mkdir -p /tmp/tour && cp testdata/fixtures/globals.c /tmp/tour/
gcc -g -O0 -no-pie -o /tmp/tour/globals /tmp/tour/globals.c
./gdb-wui -project /tmp/tour -exe globals
Set a breakpoint on line 64 (walk(&s);) and press Run. Press F10 and you land on line 65, having run all of walk. Restart and press F11 instead, and you land on line 44, inside walk. Shift+F11 from there runs the rest of walk and returns you to line 65.
Holding F10 down walks the marker through the code. Steps do not queue: one key repeat produces at most one step per completed stop, so releasing the key leaves you where you can see rather than several stops further on.
What running and stepping do not do
- Reverse debugging is not supported. There is no
reverse-step, and norrintegration. - Non-stop mode is not supported. All threads stop together and continue together; see threads.
- Follow-fork and multiple inferiors are not supported. gdb-wui debugs one program at a time.
- Running until a condition has no UI. Put a condition on a breakpoint at the console instead.
- Run to has no keyboard shortcut. It is a menu entry on the line the pointer is over, and there is no cursor in these views for a key to act on.