Troubleshooting
Errors you may see, and what they mean. Most are gdb’s or Ghidra’s own messages, passed through unchanged, so they sometimes need translating.
The decompiler needs 12.1.2 or newer
decompilation unavailable: ghidra: /opt/ghidra_12.0.4_PUBLIC is Ghidra 12.0.4,
and the decompiler needs 12.1.2 or newer; unpack a newer release and point
-ghidra or GHIDRA_INSTALL_DIR at it
Unpack Ghidra 12.1.2 or later from ghidra-sre.org and point -ghidra at that instead. The scripts gdb-wui runs inside Ghidra call DecompileOptions.setCommentIndent, which arrived in 12.1, so against an older release they do not compile and the Decompiled tab never gets a decompiler.
gdb-wui reads the version and refuses at startup because Ghidra’s own failure says nothing useful. What reaches application.log is a bare ClassNotFoundException: DecompServer not found by <hash> [1] from the OSGi class loader, which reads like a bundle wiring problem; the javac errors that actually explain it go to analyzeHeadless’s standard output and are never logged. If you are reading a log from an older gdb-wui, they are in gdb-wui’s own output just above ERROR REPORT SCRIPT ERROR.
Path element starting with ‘.’ is not permitted
ghidra: Abort due to Headless analyzer error: Path element starting with '.' is not permitted
Ghidra rejects any path containing an element that begins with a dot, not only the last one. ~/.cache/gdb-wui/ghidra is rejected, and so is /home/you/.config/x/visible/ghidra.
This rules out the conventional per-user cache locations, since $XDG_CACHE_HOME is ~/.cache and $XDG_STATE_HOME is ~/.local/state, which is why gdb-wui caches analysis in <project>/gdb-wui-decomp instead.
You will see this error if your project directory is itself under a dotted directory, because then nothing inside it can hold the cache either. To fix it, put the cache somewhere else:
./gdb-wui -project ~/.local/src/firmware -decomp-dir /var/tmp/gdb-wui-decomp
gdb-wui checks the path itself and falls back to a temporary directory rather than failing, because Ghidra’s own message names neither the path nor the offending element, and only appears after a JVM has started.
gdb does not know that architecture
A stock gdb supports only the architecture it was built for. Pointed at a MIPS or AArch64 binary it will not disassemble, the registers will be wrong or missing, and connecting to a stub produces errors that look like the stub’s fault.
To fix this, install a suitable gdb and select it with -gdb:
sudo apt install gdb-multiarch
./gdb-wui -project . -gdb gdb-multiarch -exe firmware
Note that loading the ELF is what sets the architecture. Loading only symbols, with symbol-file or add-symbol-file, does not — which is why the Symbols pane’s + load button says so, and why loading symbols against the wrong architecture leaves you with correct-looking names over disassembly that is not meaningful.
‘counter’ has unknown type; cast it to its declared type
gdb knows where the symbol is but not what type it is. This is normal for a release build: no DWARF, but an intact ELF symbol table.
To read the value, cast it. Against globals-nodebug, which the Symbols page builds:
(gdb) p counter
'counter' has unknown type; cast it to its declared type
(gdb) p (int)counter
$1 = 7
(gdb) p (char *)&banner
$2 = 0x404060 <banner> "gdb-wui"
Take the address of anything that is not a scalar. p (char *)banner casts the array’s first eight bytes to a pointer and dereferences those, which gives Cannot access memory at address 0x6975772d626467 — the characters of gdb-wui read as an address.
Hovering such a symbol shows its address rather than a value, for the same reason. The memory viewer needs no type at all and will name the row for you.
No function at 0x111b900
The address is not in the program the decompiler holds. In a running process that usually means it is in a shared library, in the dynamic loader, or in an emulator’s own mapping rather than in your binary.
The message names the program Ghidra does hold, so you can see the mismatch. If the address should be in your binary, the load bias is wrong: check that the program shown in the Decompiled tab is the one you are running.
Everything decompiles to FUN_00401136
Ghidra found no symbol table, so it named every function after its address. The decompiled C is still correct — the recovered logic does not depend on names — but nothing is named.
This is what a fully stripped binary looks like. To confirm:
readelf -S ./yourprogram | grep symtab # no output means stripped
nodebug in testdata/fixtures is built this way on purpose, so it is something to compare against: it is built by the disassembly page, and the same command against globals-nodebug from the Symbols page prints a .symtab line.
If you have an unstripped copy or a separate symbol file, load it with the Symbols pane’s + load, using Add symbols… with an offset if the image does not run where it was linked.
No source file named /tmp/tour/hello.c.
The path you asked for is not the path the binary records. A compiler writes down the file exactly as it was given on the command line, together with the directory it was run in, and gdb knows the file by those two and nothing else:
cd ~/src/gdb-wui
gcc -g -o /tmp/tour/hello testdata/fixtures/hello.c
readelf --debug-dump=info /tmp/tour/hello | grep -m2 -E 'DW_AT_(name|comp_dir)'
#    DW_AT_name     : testdata/fixtures/hello.c
#    DW_AT_comp_dir : /home/you/src/gdb-wui
So the program in /tmp/tour has no hello.c beside it, the file tree has nothing to click, and a breakpoint asked for as /tmp/tour/hello.c:14 is refused — gdb has never heard that name. Meanwhile gdb-wui serves only what is under -project, so even the copy gdb can find, back in the source tree, is not one it may show you.
Two ways out:
- Build from a copy inside the project, which is what every example in this documentation does:
cp testdata/fixtures/hello.c /tmp/tour/and then compile/tmp/tour/hello.c. The recorded path is then the one you are looking at. - Tell gdb where the source is, if rebuilding is not an option. Put the file in the project and gdb-wui offers it in a bar when it stops in a frame whose file it cannot find; choosing it substitutes the whole directory. See when the source is not where gdb expects.
globals.c is newer than the program — line numbers may be wrong
The source file on disk has changed since the binary was built, so the line table points at lines that have moved. Rebuild the program.
This message is worth acting on rather than dismissing: it explains a breakpoint that lands a couple of lines away from where you clicked.
Program received signal SIGTERM, on every single step
If your target is qiling, this is a bug in its gdb stub rather than anything to do with your program. handle_s, the handler for a hardware single-step, decides what to report from emu_state, which is set to STOPPED after every uc.emu_start(). That means “not currently inside emu_start” rather than “the program terminated”, so the handler reports SIGTERM for every successful step.
The step itself works; only the reply is wrong.
You will see this on AArch64 and x86 but not on MIPS, and the difference is in gdb rather than in the emulator. MIPS has no hardware single-step, so gdb emulates one: it works out the address of the next instruction, sets a breakpoint there, and sends vCont;c. That goes through the stub’s continue handler, which classifies the stop correctly. On AArch64, gdb sends vCont;s and reaches the broken handler.
The login link expired
The login link is single-use and lasts 60 seconds. To get another without losing your gdb session or breakpoints:
./gdb-wui -print-url
The Decompiled tab says “Ghidra is starting”
Import and analysis take seconds for a small program and minutes for firmware. The Log tab shows Ghidra’s progress line by line, which is why that log is not behind a flag: without it, a slow start looks the same as a stuck one.
If it never finishes, the log will say why in Ghidra’s own words.
The call stack is all ?? ()
gdb has no symbol for the functions of a stripped binary, so it says so. To get names, run gdb-wui with -ghidra: the decompiler knows what is there, and the frames are named once it has analysed the binary. See naming the call stack.
Those names are the decompiler’s, not symbols, and are shown in italics to say so. Frames in libc keep gdb’s own names. Right-clicking one offers to rename it.
Hovering a decompiled local shows nothing
Three different reasons, and the pane distinguishes them.
A decompiler temporary — iVar1, uVar2 — exists nowhere in the machine, so there is nothing to read. A variable the decompiler put in a register is only that register near one program counter, and away from it the row is blank rather than wrong.
The third is the architecture. Turning Ghidra’s stack offsets into an address needs the frame base, which is recovered differently on every ABI and is established by measurement: x86, ARM, AArch64, PowerPC and MIPS have one — both widths of each — and on anything else stack locals show nothing at all. A guess there would read as a value from the neighbouring slot. See stack offsets.
Rename is greyed out in the Decompiled tab
You started gdb-wui with -ghidra-project, so the decompilation is coming from a project of yours. That one holds your own names, types and comments, and gdb-wui only ever reads it — the menu items stay visible and say so on hover rather than disappearing. Commenting is greyed out for the same reason and can be read the same way.
Drop -ghidra-project and pass -ghidra alone to work in the project gdb-wui imports for itself, which it may write to. Names made there are keyed on the binary’s SHA-256 and are not visible in your own Ghidra project.
My renamed functions are back to FUN_00401136
The analysis is keyed on the binary’s SHA-256, so a rebuild gets a fresh project with none of the names. That is deliberate: reading one build’s names against another build’s addresses is a confidently wrong answer.
Nothing is lost — the old project is still on disk under the cache root, keyed by the old hash — but there is no way to carry names across a rebuild. Name a binary you intend to keep.
Which version am I running?
Click ? in the toolbar.
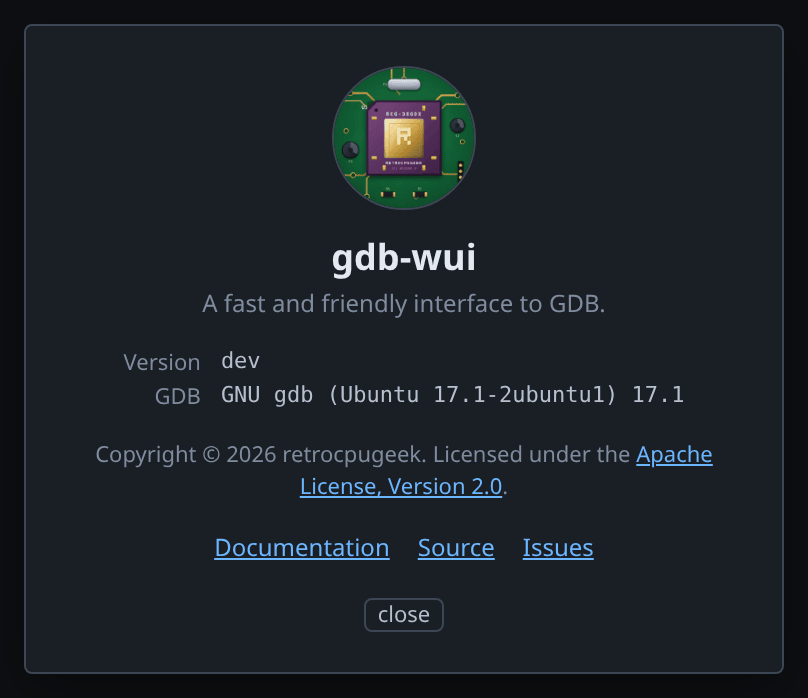
The box reports the gdb-wui build and the gdb behind it. Both are worth quoting in a bug report, because most of what gdb-wui shows comes from gdb and its answers differ between versions.
The version comes from the server rather than the page, so a browser tab left open across a restart reports the server it is actually talking to.