Decompilation
The Decompiled tab shows Ghidra’s recovered C for the function you are stopped in, with the program counter marked in it. It is for binaries with no source.
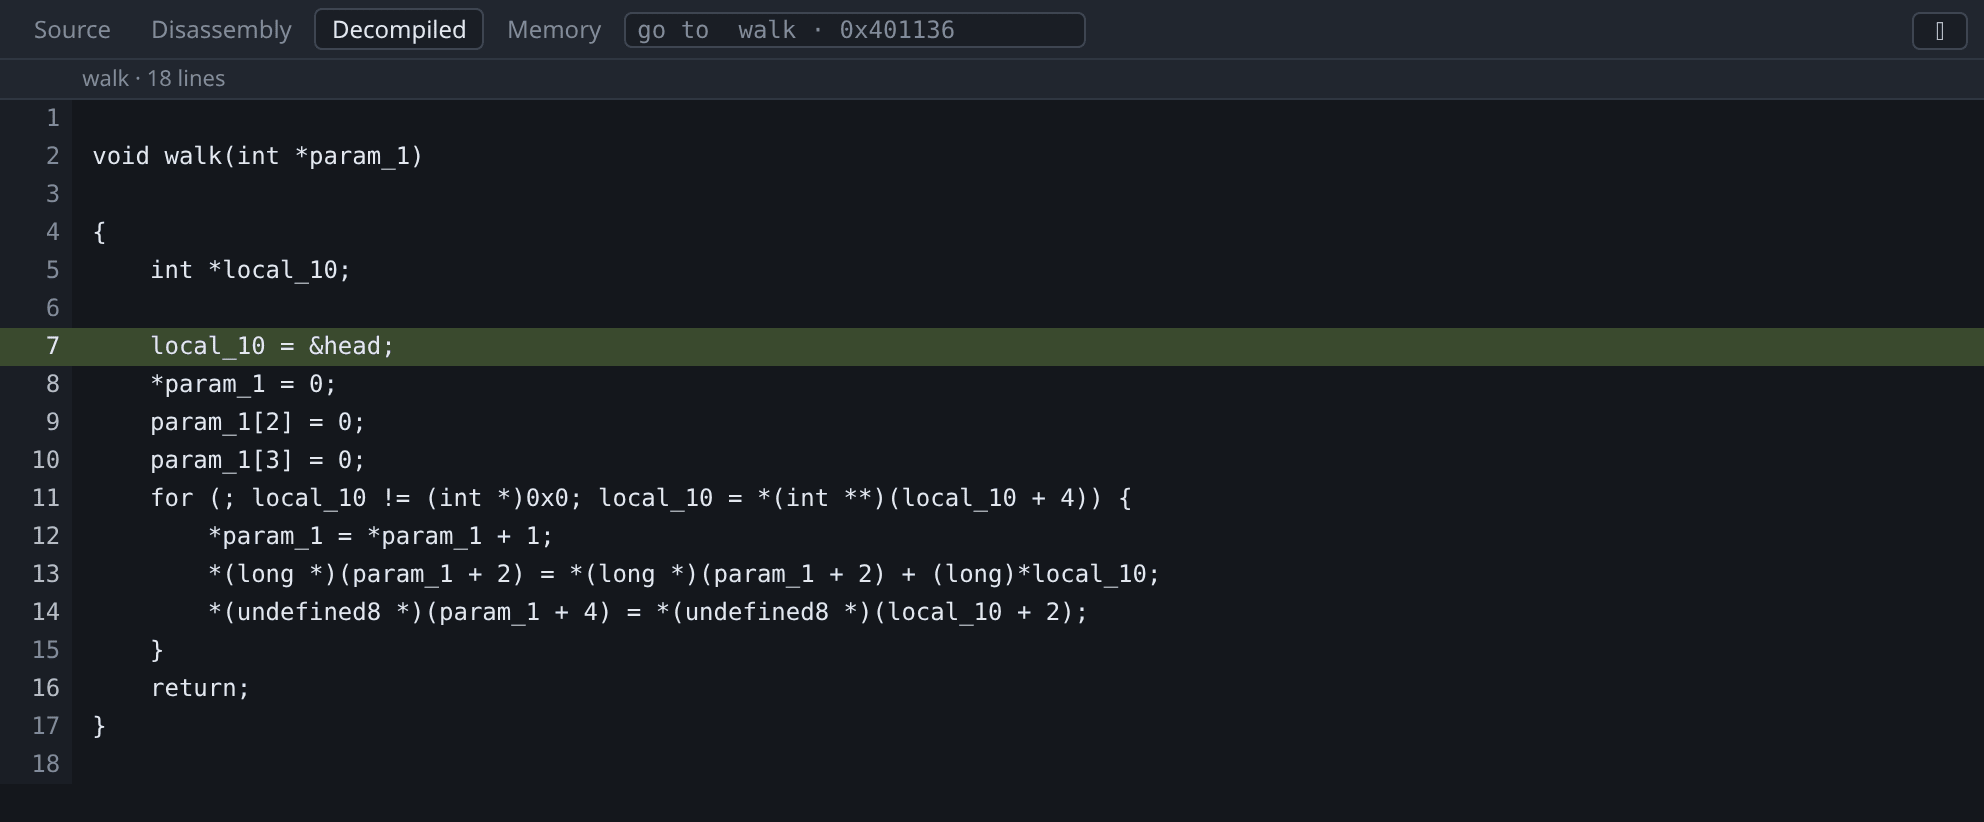
The screenshot shows walk from the tour’s program with its debug info removed. The parameter is called param_1 and the local local_10, because those names were in the DWARF that was stripped. &head is still &head, because the ELF symbol table survived and Ghidra reads that too. On a fully stripped binary every function is named after its address, such as FUN_00401156.
This tab needs the -ghidra argument, and Ghidra 12.1.2 or newer. See Install.
To decompile a particular function rather than the one being executed, type its name or an address into the go-to box at the right of the tab strip. See jumping to a file, symbol or address.
Naming the call stack
Frames that gdb cannot name are named by the decompiler, once it has finished analysing. Without it every frame inside a stripped binary reads ?? ().
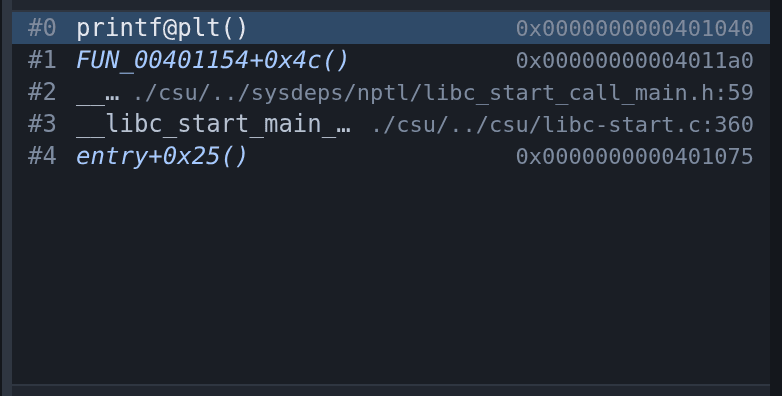
Recovered names are italic, and hovering one shows the recovered prototype. They are marked because they are not symbols: FUN_00401154 is obviously a guess, but a function you have renamed in Ghidra is not, and a stack that showed the two alike would be claiming knowledge it does not have.
Three details in that screenshot:
#1and#4are the program’s own functions. gdb had nothing; these names and the+0x4coffsets come from Ghidra. The offset matters — every frame but the innermost is a return address partway through a function, and a bare name would be equally true of a hundred instructions.#2and#3are libc, named by gdb from libc’s own symbols and left alone. A real symbol beats a recovered one.#0isprintf@plt, which is inside the program, so the decompiler has a name for it too — and it is not used, for the same reason.
Names appear when analysis finishes, so the stack changes under you the first time you stop in a binary Ghidra has not seen before. Nothing needs to be open for this: the Decompiled tab can stay shut, and passing -ghidra is the opt-in.
Renaming a function shows your name here, so a stack you have already worked through reads in your own names — and you can rename it from the stack row itself, without leaving gdb-wui.
Following a call
Right-click a name in the decompiled text to set a breakpoint on it or jump to it. The body of a recovered function is full of names that exist nowhere else — FUN_004011d6 for a function it calls, DAT_00404040 for a global it reads — and the menu offers what to do with each:
- Set breakpoint at
FUN_004011d6— the breakpoint appears in the Breakpoints pane named the same way rather than as a bare address. - Go to
FUN_004011d6— the disassembly for a function, the memory viewer for a global.
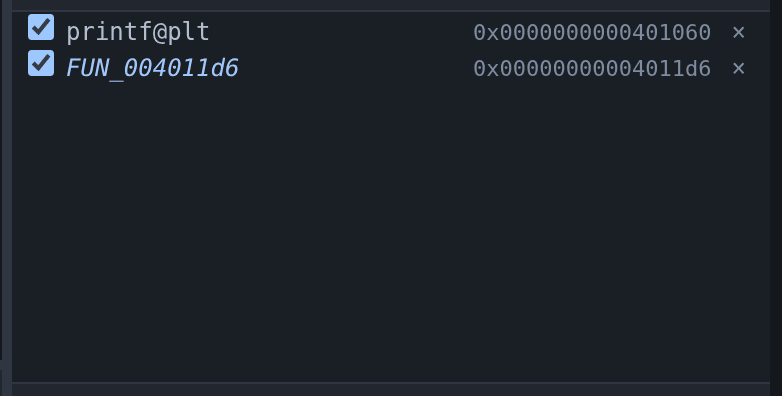
The name is resolved before the menu opens, so an item appears only where there is somewhere to go: a type name or a keyword under the pointer offers nothing. A name the binary itself carries is resolved by gdb, which means a breakpoint on one skips the prologue; a name only Ghidra has is resolved through the decompiler and breaks at the entry instruction. See breaking by name and breaking at an address.
The address is not the digits in the name. Those are where Ghidra found the function at link time, and a position-independent executable is somewhere else entirely once it is running.
Renaming variables and functions
Rename a decompiler-invented name by right-clicking it in the Decompiled tab. FUN_00401154, local_10 and undefined8 are not wrong — they are what can be known without a symbol table — but a reader holds a program in their head by its names.
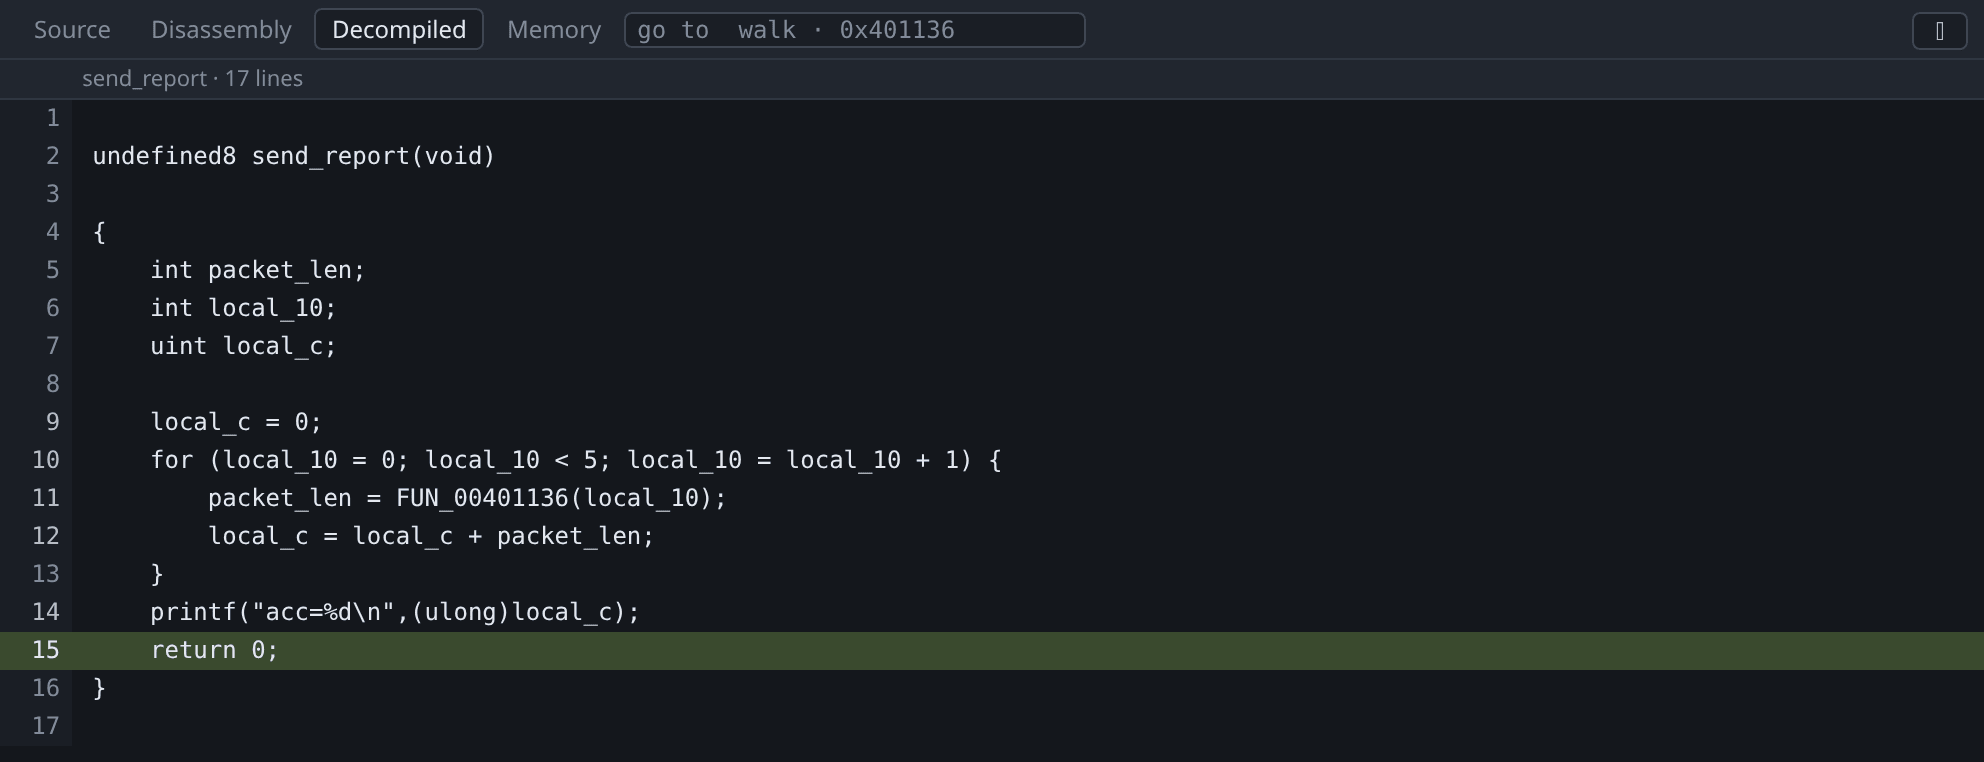
Right-click a name in the Decompiled tab:
- Rename
local_10… — the local or the global under the pointer. A decompiler temporary can be renamed too, even though it has no value to show. - Set the type of
local_10… — any C type Ghidra can parse. Getting a type right often reshapes the whole function body, which is the point. - Rename the function… and Edit the prototype… — the prototype covers the return type, the parameters and the name in one go.
- Watch
local_10— keep the value in the Variables pane, re-read at every stop. A global is the one to reach for: a fixed address is valid at every program counter, so the watch goes on reading however far you step. It arrives typed as whatever the decompiler believes, which is oftenundefined8, and the pane can cast it.
Right-clicking a recovered frame in the call stack offers the same rename, which is usually where an unhelpful name is first met.
Type the new name and press Enter. Ctrl+Shift+Z undoes the last edit.
The names go into the Ghidra project, not into anything gdb-wui invented, so everything that asks the decompiler gets the new answer at once — the pane, the call stack, the symbol list, and any other browser tab open on the same session. They are saved immediately and are there the next time you debug that binary.
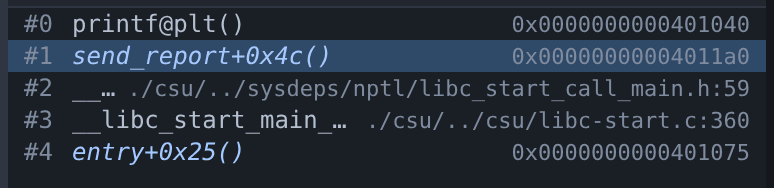
That is the same stack as the one above, after the rename: #1 was FUN_00401154+0x4c().
A renamed function still shows as recovered in the call stack. A name you typed is still not a symbol the binary carries, so it is still drawn as one the decompiler supplied.
The project is keyed on the binary’s SHA-256, so a rebuilt binary starts again with a fresh analysis and none of your names. That is deliberate — reading one build’s names against another build’s addresses is a confidently wrong answer — but it does mean the naming is worth doing on a binary you are going to keep.
Adding comments to the decompilation
Comments can be added to the decompilation by right-clicking in the Decompiled tab. There is no source file to write them in, and re-reading the recovered C will not give back what you worked out.
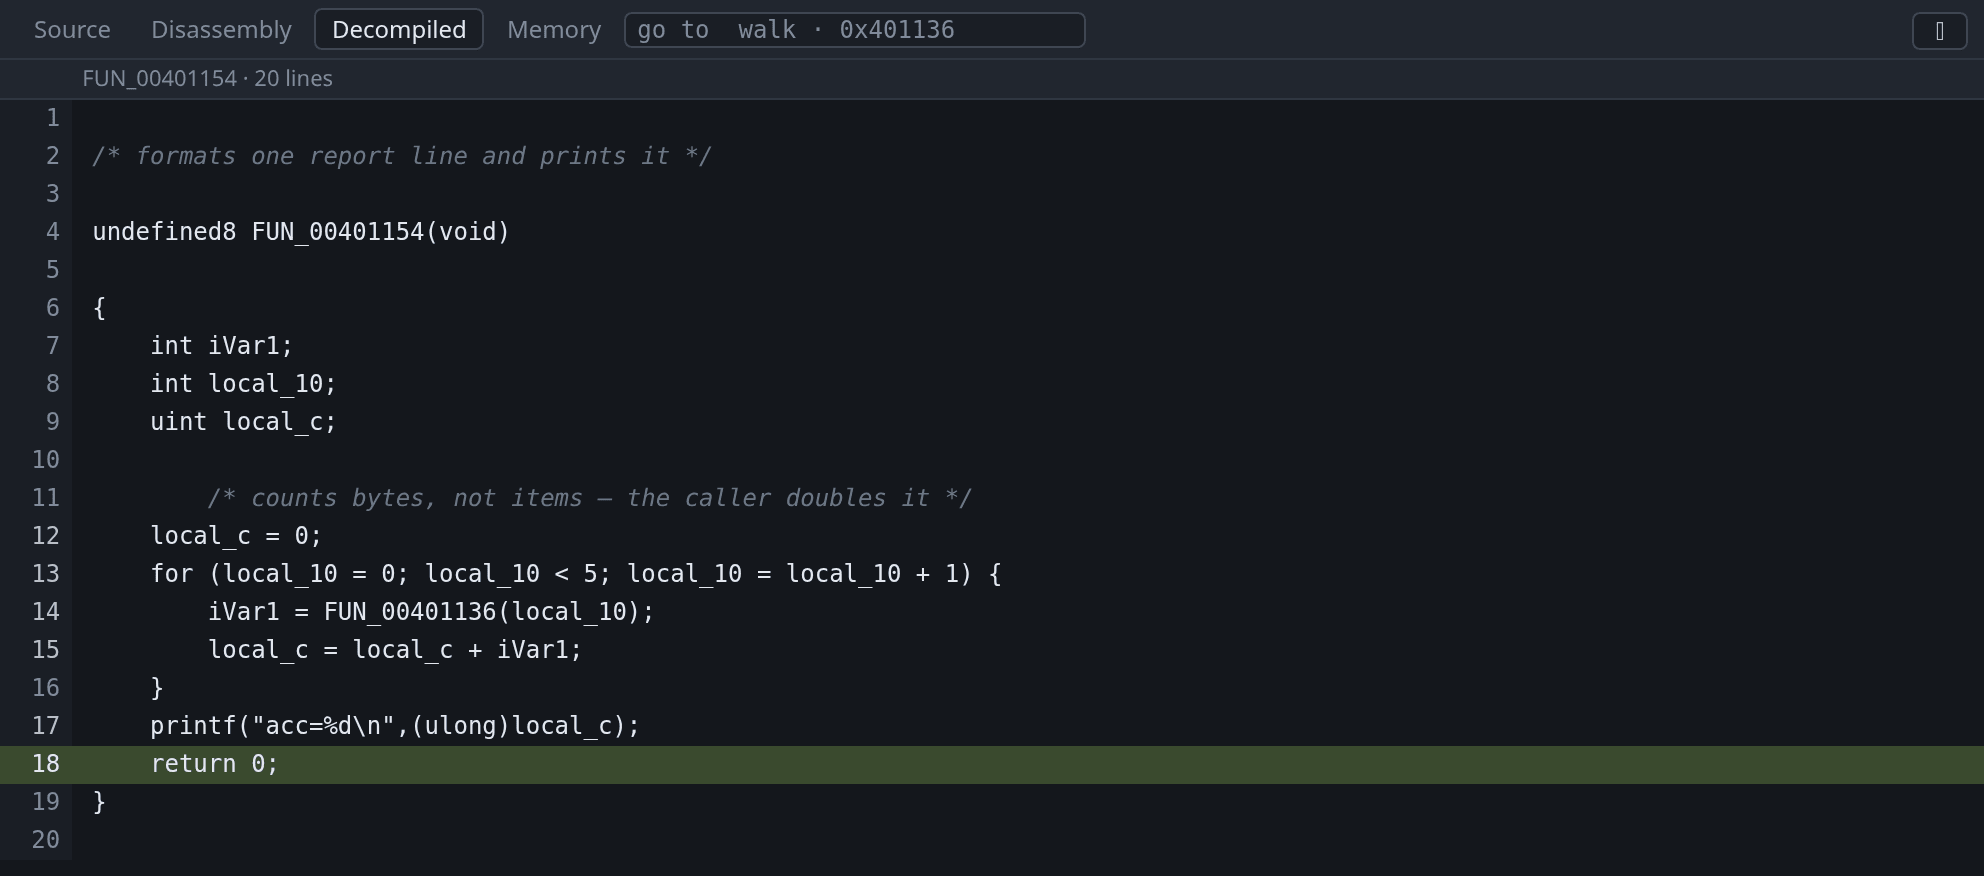
- Comment this line… — a note above that line. Right-clicking a comment offers Edit the comment on this line… instead, opening on what you typed, and Remove the comment on this line.
- Comment the function… — a note above the whole function, where its purpose belongs.
A line that came from no address — a brace, a declaration, a blank — cannot hold a comment, because there is nothing to attach one to. Those are the same lines that cannot hold a breakpoint, and the gutter already shows which they are.
Comments are stored in the Ghidra project alongside the names, so they are there next time, and Ctrl+Shift+Z undoes the last one. They are also Ghidra’s comments: open the same project in Ghidra and they are in the Listing and the Decompiler windows, where you would expect them.
Comments go on a line or on a function, one line of text at a time. Longer notes wrap when the decompiler prints them.
Stepping in the decompiled view
Step by decompiled line with F10, the same key as everywhere else. gdb’s own stepping needs a line table, and without one its step range would be the whole function.
While this tab is showing, a step moves to the next decompiled line instead, using Ghidra’s address map in place of the missing line table. The gutter also sets breakpoints, by address.
To read the recovered C against the instructions it came from, rather than switching between them, split the centre view. With both showing, the focused one decides how stepping behaves.
How the program counter is marked
The pane marks the current line one of three ways, according to how well the recovered C maps to the address. Recovered C is a model of the program rather than its source, so the mapping is not always exact:
- Filled — a decompiled line claims the program counter’s address exactly.
- Outlined, with
pc between linesin the header — no line claims the address, and this is the nearest line below it. Prologues, epilogues and register spills belong to no expression, so this is normal. - Marked ambiguous — more than one line claims the address. Optimised code merges statements, and the map cannot separate them again.
A local that the decompiler invented, which lives nowhere in the machine, shows no value rather than a wrong one. A local on the stack needs one thing more: a rule turning the decompiler’s frame offsets into an address, measured against a live inferior on x86, ARM, AArch64, PowerPC and MIPS. Outside those, or in a frame whose depth Ghidra cannot settle on, a stack local shows no value either. Around two thirds of recovered locals live in a register that is only correct near one program counter, whereas a global at a fixed address is valid at every one, so globals are the ones you can rely on.
Watching the import and analysis

The Log tab shows Ghidra’s activity: what it imported, how long analysis took, one line per decompiled function with its timing, and Ghidra’s own messages. Unlike the raw MI stream this is not behind a flag, because it is one line per operation and it is the only way to tell a slow start from a stuck one.
Import and analysis take seconds for a small program and minutes for firmware. The result is cached under <project>/gdb-wui-decomp, keyed on the binary’s SHA-256, so later runs are immediate.
Images too big to analyse
Past 4 MB of code, gdb-wui imports the image without Ghidra’s analysis and disassembles each function as it is opened. Nothing is needed from you; the log says when it happens. Import drops to seconds, and the first time you open a function costs a few tens of milliseconds more than the times after it.
The reason is that Ghidra’s analysis walks the whole image — disassembling everything, propagating constants between functions, building the cross-references — and past a few megabytes of code that stops finishing. A 12 MB MIPS64 kernel, 6.9 MB of it code, exhausts analyzeHeadless’s 2 GB heap and the import fails outright.
What you keep is what the decompiler produces on its own: the C, the variables, the stack rule and every function in the symbol table — a kernel arrives with all 22,000 of them named. What you lose is the whole-program work: cross-references, recovered parameter types, and strings identified as strings.
An image with no symbol table has nothing to list this way, so auto takes lean for that case instead: the analyzers that find functions, without the ones that cost the memory. They arrive named after their addresses, because nothing knows what they were called. If something else does — a kernel’s own kallsyms, or nm output from an unstripped build — -ghidra-symbols takes a file of address [type] name lines and names them. See debugging a kernel, which is where both of these come up.
-ghidra-analysis overrides the choice — full to analyse anyway and wait, none to skip it on a smaller binary. Raising Ghidra’s heap raises the ceiling too: GHIDRA_MAXMEM=8G is passed through to the Ghidra gdb-wui spawns. Each kind of project is cached separately, so switching either flag re-imports rather than handing back the one you already have.
Decompiling a file gdb did not load
-ghidra-binary names the file for Ghidra directly, for the cases where the program gdb has is not the one to reverse — or where gdb has no program at all. An emulator booting a raw kernel image is the second: the image has no ELF header, gdb refuses it, and without this flag the decompiler has nothing to open. Such an image also needs -ghidra-processor to say what its bytes are and -ghidra-base to say where they run, since nothing in the file does. See a kernel image gdb will not load.
A program gdb-wui did not load
The decompiler normally works on the program loaded from the file tree. When gdb has one gdb-wui never loaded — target remote to a gdbserver started with a program, attach, a file typed in the console — it asks gdb which one that is, and decompiles it:
- A path on this machine is read where it is.
- A
target:path, which is how gdb names a file on the far side of a gdbserver, is copied from the target with gdb’s ownremote getinto a directory of the session’s, removed when it ends. The gdbserver may be on another machine with a different file at the same path, so the copy is what is decompiled — and what the bias and the sidecar lookup use.
Copying goes at the speed of the connection: a second for a few hundred kilobytes over a network, longer over a serial line. Connecting to a different program replaces the decompilation, as loading one does.
Decompiling without Ghidra: sidecars
Ghidra wants a desktop: an 884 MB install, a JDK, a gigabyte or two of memory and minutes of analysis. The machine being debugged is often none of those — a single-board computer, a router, an emulator. A sidecar is the whole decompilation of one binary in a file: written once on a machine that has Ghidra, it is shown on any other, with no Ghidra there at all.
# where Ghidra is
./gdb-wui -ghidra ~/ghidra -write-sidecar build/firmware -decomp-sidecars sidecars/
# anywhere else, Ghidra or not
./gdb-wui -project . -exe firmware -decomp-sidecars sidecars/
-write-sidecar analyses the file in a project of its own, decompiles every function, writes firmware.decomp.json and exits; it takes the same -ghidra-analysis, -ghidra-symbols, -ghidra-processor and -ghidra-base as an import. That is tens of seconds for a program of a few thousand functions, and the file is about four kilobytes per function — ten megabytes for busybox, one compressed.
-decomp-sidecars names a directory. A sidecar is matched to the program gdb loads by the binary’s sha256, so names do not matter and a rebuilt binary is never shown a stale decompilation; loading another program switches to its sidecar. When there is none, the pane says so — or, with -ghidra as well, Ghidra decompiles it as usual.
Everything the pane does reading a decompilation works from a sidecar: the program counter marked, naming the call stack, following a call, the decompiler’s names in the Symbols pane, stepping by decompiled line. Changing it does not: renaming, retyping and comments need a Ghidra to re-decompile, and a sidecar is read-only.
The format is described in the decompilation reference.
Decompiling with kuna
kuna is Ghidra’s decompiler ported to Rust. It needs no JVM, no project and no analysis: it indexes a program’s functions in a fraction of a second and decompiles each one as it is opened, in about half a second for busybox. That makes it the decompiler for a program nobody wrote a sidecar for, on a machine that cannot run Ghidra.
gdb-wui runs it through kuna_wasm, the entry point kuna’s own browser page uses, built natively:
# in a kuna checkout
make specs
(cd decompiler && cargo build --release -p kuna-wasm)
# then
./gdb-wui -project . -exe firmware \
    -kuna ~/kuna/decompiler/target/release/kuna_wasm -kuna-specs ~/kuna/specs
Or the same commands answered over TCP, with -kuna tcp:HOST:PORT: that is how the try-online machines do it, where gdb-wui runs in the emulated guest and kuna, as WebAssembly, in the page around it. The protocol is in internal/ghidra/kuna.go.
Like a sidecar, kuna decompiles the program gdb loaded, and loading another switches to it. It is read-only: kuna keeps no database for a rename or a comment to go into. Its names are its own — sub_d830 for a function nobody named, dat_eb270 for a global — and on a stripped program it recovers main and the names of library functions called through the PLT.
What it says about a variable’s location is less settled than Ghidra’s: it merges a variable across every place it lives (a4 | a5 | stack - 0x58) and does not say which holds the value at a given instruction. A variable with one stack slot among them is read from the slot — its home, in unoptimised code, where every variable is kept in memory and loaded into registers to be used; in optimised code a register may be ahead of it. One that lives in a single register is read from the register. Any other is listed without a value, because a wrong guess would read as one.
Ghidra and kuna side by side
With both a Ghidra (or a sidecar for the program) and -kuna, a sidecar or Ghidra is used first, and the Decompiled view’s header has a picker: switching shows the same function in the other decompiler’s words.
Which decompiler, and how it is doing
The end of the Decompiled view’s header says which decompiler is in use and what it knows — kuna 8ad9545 · 918 functions, Ghidra 12.1.3 · 2464 functions — or that it is starting, or in red that it failed. Its tooltip has the rest: where the decompiler is (the address of a kuna over TCP, a sidecar’s file), the program and its language, when it became ready, and the error. The Log tab has a line for each thing it does, prefixed kuna: or ghidra:.
A kuna over TCP is a connection that can go: the page serving it can restart its worker, which forgets the program it was sent. The next decompile then connects again or sends the program again, once, and says so in the log, rather than failing until gdb-wui is restarted.
Using an existing Ghidra project
To use names and types you have already created in Ghidra, pass the project and the program within it:
./gdb-wui -project . -exe firmware \
  -ghidra-project ~/ghidra-projects/firmware-re.gpr \
  -ghidra-program firmware
Your names, types and comments are used and nothing is written back: renaming and commenting are disabled for a project you named, and the menu items say so. gdb-wui only edits the project it imported itself. -ghidra-program is required, because a Ghidra project usually holds several programs.
To see it work without a project of your own, the decompilation reference builds one with analyzeHeadless from an example program and points gdb-wui at that.
Worked example
mkdir -p /tmp/tour && cp testdata/fixtures/globals.c /tmp/tour/
gcc -g -O0 -no-pie -o /tmp/tour/globals-nodebug /tmp/tour/globals.c
objcopy --strip-debug /tmp/tour/globals-nodebug
./gdb-wui -project /tmp/tour -exe globals-nodebug -ghidra ~/ghidra
Filter the Symbols pane to walk, right-click it, choose Set breakpoint, and press Run. Open Decompiled: the first time, the Log tab shows the import and analysis; afterwards it is immediate.
You stop in the prologue, so the header says pc between lines. Press F10 twice and the marker becomes a solid highlight on local_10 = &head;. In the source that line is struct node *n = &head;.
What decompilation does not do
- It does not edit a project you named.
-ghidra-projectis read-only: renaming works only in the project gdb-wui imports for itself. - It does not edit struct fields. Names, variable types, function prototypes and comments, but not the members of a type.
- It does not name every pane. It names the call stack, the symbol pane, the breakpoint list, a watch on an address and the memory viewer’s symbol column. The Threads pane shows a frame per thread and leaves gdb’s
??on it. - It does not know how far an untyped label runs, so the memory column names such a label on its own row and nothing after it. Ghidra represents an unexamined byte as one undefined item whatever follows it; giving the label a type is what establishes the extent, and then the whole object is named.
- It does not name a frame outside the program. libc and the dynamic loader are not in the binary Ghidra was given, so their frames keep whatever gdb says — usually a real symbol, sometimes nothing.
- It does not reproduce the source. Recovered C compiles to the same behaviour, not to the same text: loop shapes change, variables merge, and types are inferred. Read it as a model.
- It does nothing without Ghidra, and prints no warning until you open the tab.
- It does not analyse a large image, and says so: past 4 MB of code the import skips Ghidra’s analysis, which costs cross-references and recovered parameter types. See images too big to analyse.